One moment please, your device is loading the charts...
Population numbers in the city district Baden-Baden for the years 2009 thru 2019.
The number of inhabitants is the number of persons as registered in the population register on January 1st.
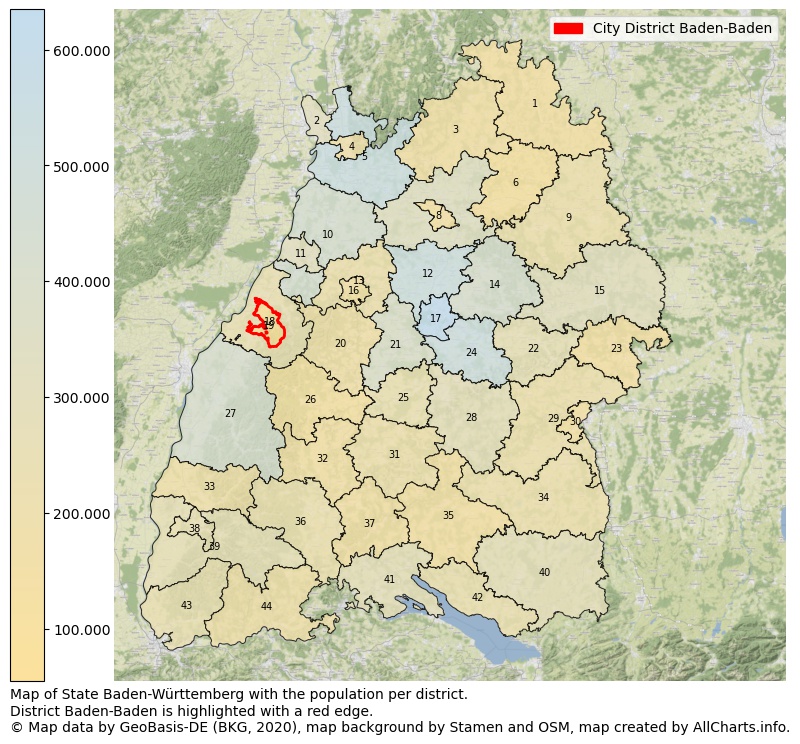
Map of State Baden-Württemberg with the population per district.District Baden-Baden is highlighted with a red edge. The numbers at the map represent the following districts: 1: rural district Main-Tauber-Kreis, 2: city district Mannheim, 3: rural district Neckar-Odenwald-Kreis, 4: city district Heidelberg, 5: rural district Rhein-Neckar-Kreis ...Show more... Map of State Baden-Württemberg with the population per district.District Baden-Baden is highlighted with a red edge. The numbers at the map represent the following districts: 1: rural district Main-Tauber-Kreis, 2: city district Mannheim, 3: rural district Neckar-Odenwald-Kreis, 4: city district Heidelberg, 5: rural district Rhein-Neckar-Kreis, 6: rural district Hohenlohekreis, 7: rural district Heilbronn, 8: city district Heilbronn, 9: rural district Schwäbisch Hall, 10: rural district Karlsruhe, 11: city district Karlsruhe, 12: rural district Ludwigsburg, 13: rural district Enzkreis, 14: rural district Rems-Murr-Kreis, 15: rural district Ostalbkreis, 16: city district Pforzheim, 17: city district Stuttgart, 18: rural district Rastatt, 19: city district Baden-Baden, 20: rural district Calw, 21: rural district Böblingen, 22: rural district Göppingen, 23: rural district Heidenheim, 24: rural district Esslingen, 25: rural district Tübingen, 26: rural district Freudenstadt, 27: rural district Ortenaukreis, 28: rural district Reutlingen, 29: rural district Alb-Donau-Kreis, 30: city district Ulm, 31: rural district Zollernalbkreis, 32: rural district Rottweil, 33: rural district Emmendingen, 34: rural district Biberach, 35: rural district Sigmaringen, 36: rural district Schwarzwald-Baar-Kreis, 37: rural district Tuttlingen, 38: city district Freiburg im Breisgau, 39: rural district Breisgau-Hochschwarzwald, 40: rural district Ravensburg, 41: rural district Konstanz, 42: rural district Bodenseekreis, 43: rural district Lörrach, 44: rural district Waldshut ...Show less...
One moment please, your device is loading the charts...
City district Baden-Baden, 2019, number of rooms per house.
The percentage shows the relative share of houses per category based on the numer of rooms: 1 to 2 rooms, 3 to 4 rooms or 5 rooms or more. This is based on the total number of rooms as identified for all dwellings in the city district Baden-Baden.
The table below shows data for more than 100 topics as most recently available for the city district Baden-Baden. Select a category to display the related topics:
| Business | Value | Unit | Year |
|---|---|---|---|
| Businesses | 31 | Number | 2017 |
| Active persons | 4.436 | Number | 2017 |
| Gross wages | €210.270 | Euro | 2017 |
| Dwellings | Value | Unit | Year |
|---|---|---|---|
| Houses 1 room | 1.173 | Number | 2019 |
| Houses 2 rooms | 2.649 | Number | 2019 |
| Houses 3 rooms | 6.793 | Number | 2019 |
| Houses 4 rooms | 8.311 | Number | 2019 |
| Houses 5 rooms | 5.159 | Number | 2019 |
| Houses 6 rooms | 2.889 | Number | 2019 |
| Houses 7+ rooms | 3.106 | Number | 2019 |
| Houses 1-2 rooms | 3.822 | Number | 2019 |
| Houses 3-4 rooms | 15.104 | Number | 2019 |
| Houses 5+ rooms | 11.154 | Number | 2019 |
| 1-2 rooms | 13% | Percentage | 2019 |
| 3-4 rooms | 50% | Percentage | 2019 |
| 5+ rooms | 37% | Percentage | 2019 |
| Elections | Value | Unit | Year |
|---|---|---|---|
| Voters Bundestag | 38689,00 | Number | 2017 |
| Voter turnout Bundestag | 76 | Number | 2017 |
| Votes valid Bundestag | 28.964 | Number | 2017 |
| Votes Bundestag CDU/CSU | 10.796 | Number | 2017 |
| Votes Bundestag SPD | 4.571 | Number | 2017 |
| Votes Bundestag GRÜNE | 3.835 | Number | 2017 |
| Votes Bundestag FDP | 3.996 | Number | 2017 |
| Votes Bundestag DIE LINKE | 1.778 | Number | 2017 |
| Votes Bundestag AfD | 3.087 | Number | 2017 |
| Votes Bundestag other parties | 901 | Number | 2017 |
| Votes Bundestag total | 28.964 | Number | 2017 |
| % Votes Bundestag CDU/CSU | 28% | Percentage | 2017 |
| % Votes Bundestag SPD | 12% | Percentage | 2017 |
| % Votes Bundestag GRÜNE | 10% | Percentage | 2017 |
| % Votes Bundestag FDP | 10% | Percentage | 2017 |
| % Votes Bundestag DIE LINKE | 5% | Percentage | 2017 |
| % Votes Bundestag AfD | 8% | Percentage | 2017 |
| % Votes Bundestag other parties | 2% | Percentage | 2017 |
| Employment | Value | Unit | Year |
|---|---|---|---|
| Employees | 21.487 | Number | 2019 |
| Employees male | 11.313 | Number | 2019 |
| Employees female | 10.174 | Number | 2019 |
| Employees foreigner | 4.538 | Number | 2019 |
| Employees male foreigner | 2.691 | Number | 2019 |
| Employees female foreigner | 1.847 | Number | 2019 |
| Unemployed | 1.356 | Number | 2018 |
| Unemployed foreigners | 524 | Number | 2018 |
| Unemployed severely disabled | 96 | Number | 2018 |
| Unemployed 15-20 | 16 | Number | 2018 |
| Unemployed 15-25 | 89 | Number | 2018 |
| Unemployed 55-65 | 399 | Number | 2018 |
| Unemployed long-term | 478 | Number | 2018 |
| % Unemployed | 2% | Percentage | 2018 |
| % Unemployed foreigners | 1% | Percentage of the population | 2018 |
| % Unemployed severely disabled | 0% | Percentage of the population | 2018 |
| % Unemployed 15-20 | 0% | Percentage of the population | 2018 |
| % Unemployed 15-25 | 0% | Percentage of the population | 2018 |
| % Unemployed 55-65 | 1% | Percentage of the population | 2018 |
| % Unemployed long-term | 1% | Percentage of the population | 2018 |
| Income | Value | Unit | Year |
|---|---|---|---|
| Income receivers | 28.024 | Number | 2015 |
| Income total | €1.322.734 | Euro | 2015 |
| Income tax | €283.276 | Euro | 2015 |
| Population | Value | Unit | Year |
|---|---|---|---|
| Population | 55.123 | Number | 2019 |
| Men | 26.442 | Number | 2019 |
| Women | 28.681 | Number | 2019 |
| % Men | 48% | Percentage | 2019 |
| % Women | 52% | Percentage | 2019 |
| 0-18 | 7.960 | Number | 2019 |
| 18-30 | 6.868 | Number | 2019 |
| 30-45 | 9.406 | Number | 2019 |
| 45-60 | 12.757 | Number | 2019 |
| 18-60 | 29.031 | Number | 2019 |
| 60-75 | 10.130 | Number | 2019 |
| 60+ | 18.132 | Number | 2019 |
| Average age | 47 | Average number | 2019 |
| Average age male | 45 | Average number | 2019 |
| Average age female | 49 | Average number | 2019 |
| Births | 424 | Number | 2018 |
| Births male | 236 | Number | 2018 |
| Births female | 188 | Number | 2018 |
| 1K Births | 8 | Number per 1000 inhabitants | 2018 |
| Deaths | 759 | Number | 2018 |
| Deaths male | 346 | Number | 2018 |
| Deaths female | 413 | Number | 2018 |
| 1K Deaths | 14 | Number | 2018 |
| 0-3 | 1.401 | Number | 2019 |
| Girls 0-3 | 681 | Number | 2019 |
| Boys 0-3 | 720 | Number | 2019 |
| 3-6 | 1.250 | Number | 2019 |
| Girls 3-6 | 587 | Number | 2019 |
| Boys 3-6 | 663 | Number | 2019 |
| 6-10 | 1.663 | Number | 2019 |
| 10-15 | 2.237 | Number | 2019 |
| 15-18 | 1.409 | Number | 2019 |
| 18-20 | 1.063 | Number | 2019 |
| 20-25 | 2.816 | Number | 2019 |
| 25-30 | 2.989 | Number | 2019 |
| 30-35 | 3.082 | Number | 2019 |
| 35-40 | 3.195 | Number | 2019 |
| 40-45 | 3.129 | Number | 2019 |
| 45-50 | 3.686 | Number | 2019 |
| 50-55 | 4.627 | Number | 2019 |
| 55-60 | 4.444 | Number | 2019 |
| 60-65 | 3.742 | Number | 2019 |
| 65-75 | 6.388 | Number | 2019 |
| Women 65-70 | 3.514 | Number | 2019 |
| Men 65-70 | 2.874 | Number | 2019 |
| 75+ | 8.002 | Number | 2019 |
| Women 75+ | 4.816 | Number | 2019 |
| Men 75+ | 3.186 | Number | 2019 |
| % 0-10 | 8% | Percentage | 2019 |
| % 10-18 | 7% | Percentage | 2019 |
| % 18-30 | 12% | Percentage | 2019 |
| % 30-45 | 17% | Percentage | 2019 |
| % 45-60 | 23% | Percentage | 2019 |
| % 60+ | 33% | Percentage | 2019 |
| Real estate | Value | Unit | Year |
|---|---|---|---|
| Property tax A revenue | no data | Euro | no data |
| Property tax B revenue | no data | Euro | no data |
| Trade tax actual revenue | no data | Euro | no data |
| Property tax A basic amount | no data | Euro | no data |
| Property tax B basic amount | no data | Euro | no data |
| Trade tax basic amount | no data | Euro | no data |
| Property tax A rate | no data | Euro | no data |
| Property tax B rate | no data | Euro | no data |
| Trade tax rate | no data | Euro | no data |
| Real tax raising force | no data | Euro | no data |
| Trade tax levy | no data | Euro | no data |
| Trade tax net | no data | Euro | no data |
| Community share in income tax | no data | Euro | no data |
| Community share in sales tax | no data | Euro | no data |
| Tax revenue | no data | Euro | no data |
| Regional | Value | Unit | Year |
|---|---|---|---|
| Region code | 08211 | Code | 2019 |
| Region code 8 digits | 08211 | Code | 08211 |
| Sorting code | 082110000000 | Code | 082110000000 |
| Sorting code 8 digits | 08211000 | Code | 08211000 |
| Region name | Baden-Baden | Name | 2019 |
| Regional level | 4 | Categorical type | 2019 |
| Region type | District | Categorical type | 2019 |
| Region type detail | city district | Categorical type | 2019 |
| Region name with type | city district Baden-Baden | Name | 2019 |
| Region name in German | Stadtkreis Baden-Baden | Name | 2019 |
| Direct subregions | 1 | Number | 2019 |
| NUTS code | DE121 | Code | 2019 |
| Area | 140 | Area in km² | 2019 |
| Religion | Value | Unit | Year |
|---|---|---|---|
| Roman Catholic church | 24.100 | Number | 2011 |
| Protestant church | 10.548 | Number | 2011 |
| Other or none | 17.667 | Number | 2011 |
| % Roman Catholic church | 46% | Percentage | 2011 |
| % Protestant church | 20% | Percentage | 2011 |
| % Other or none | 34% | Percentage | 2011 |
| Roman Catholic church German | 22.231 | Number | 2011 |
| Protestant church German | 10.275 | Number | 2011 |
| Other or none German | 13.407 | Number | 2011 |
| % Roman Catholic church German | 48% | Percentage | 2011 |
| % Protestant church German | 22% | Percentage | 2011 |
| % Other or none German Foreign | 29% | Percentage | 2011 |
| Roman Catholic church Foreign | 1.869 | Number | 2011 |
| Protestant church Foreign | 273 | Number | 2011 |
| Other or none Foreign | 4.260 | Number | 2011 |
| % Roman Catholic church Foreign | 29% | Percentage | 2011 |
| % Protestant church Foreign | 4% | Percentage | 2011 |
| % Other or none Foreign | 67% | Percentage | 2011 |
Data is used from multiple German open data providers. See this description of the sources with the definitions of all regional topics.
Sources & definitionsThis page will be further expanded with more topics in clear graphs. This will be done in several iterations in the coming weeks.
![]()
© Published:
 Contents and more information: