One moment please, your device is loading the charts...
Population numbers in the municipality Dorn-Dürkheim for the years 2009 thru 2019.
The number of inhabitants is the number of persons as registered in the population register on January 1st.
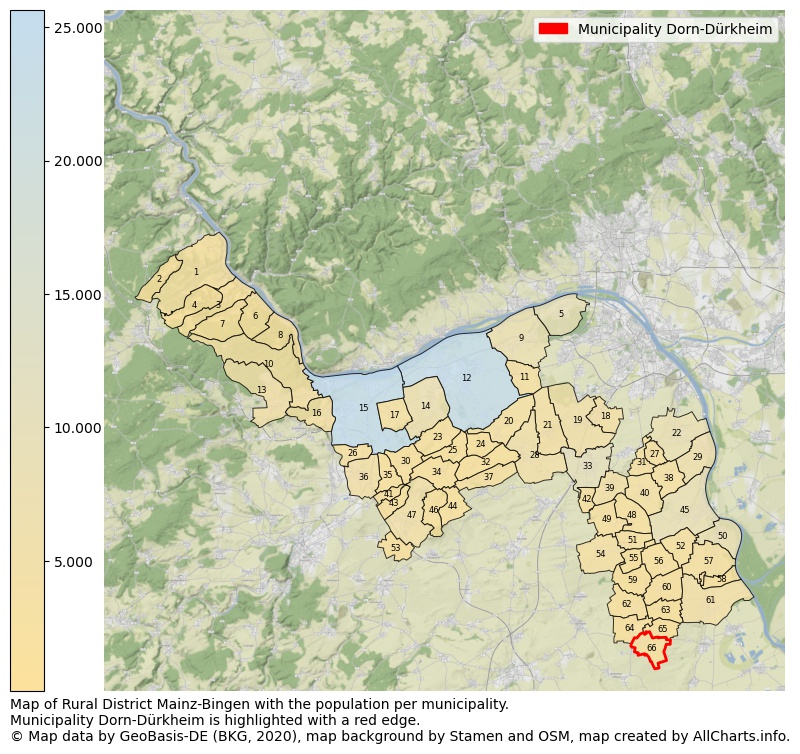
Map of Rural district Mainz-Bingen with the population per municipality.Municipality Dorn-Dürkheim is highlighted with a red edge. The numbers at the map represent the following municipalities: 1: municipality city Bacharach, 2: municipality Breitscheid, 3: municipality Oberdiebach, 4: municipality Manubach, 5: municipality Budenheim ...Show more... Map of Rural district Mainz-Bingen with the population per municipality.Municipality Dorn-Dürkheim is highlighted with a red edge. The numbers at the map represent the following municipalities: 1: municipality city Bacharach, 2: municipality Breitscheid, 3: municipality Oberdiebach, 4: municipality Manubach, 5: municipality Budenheim, 6: municipality Niederheimbach, 7: municipality Oberheimbach, 8: municipality Trechtingshausen, 9: municipality Heidesheim am Rhein, 10: municipality Weiler bei Bingen, 11: municipality Wackernheim, 12: municipality city Ingelheim am Rhein, 13: municipality Waldalgesheim, 14: municipality city Gau-Algesheim, 15: municipality city Bingen am Rhein, 16: municipality Münster-Sarmsheim, 17: municipality Ockenheim, 18: municipality Klein-Winternheim, 19: municipality Ober-Olm, 20: municipality Schwabenheim an der Selz, 21: municipality Essenheim, 22: municipality Bodenheim, 23: municipality Appenheim, 24: municipality Bubenheim, 25: municipality Nieder-Hilbersheim, 26: municipality Grolsheim, 27: municipality Gau-Bischofsheim, 28: municipality Stadecken-Elsheim, 29: municipality Nackenheim, 30: municipality Aspisheim, 31: municipality Harxheim, 32: municipality Engelstadt, 33: municipality city Nieder-Olm, 34: municipality Ober-Hilbersheim, 35: municipality Horrweiler, 36: municipality Gensingen, 37: municipality Jugenheim in Rheinhessen, 38: municipality Lörzweiler, 39: municipality Zornheim, 40: municipality Mommenheim, 41: municipality Welgesheim, 42: municipality Sörgenloch, 43: municipality Zotzenheim, 44: municipality Wolfsheim, 45: municipality city Nierstein, 46: municipality Sankt Johann, 47: municipality Sprendlingen, 48: municipality Selzen, 49: municipality Hahnheim, 50: municipality city Oppenheim, 51: municipality Köngernheim, 52: municipality Dexheim, 53: municipality Badenheim, 54: municipality Undenheim, 55: municipality Friesenheim, 56: municipality Dalheim, 57: municipality Dienheim, 58: municipality Ludwigshöhe, 59: municipality Weinolsheim, 60: municipality Uelversheim, 61: municipality Guntersblum, 62: municipality Dolgesheim, 63: municipality Eimsheim, 64: municipality Hillesheim, 65: municipality Wintersheim, 66: municipality Dorn-Dürkheim ...Show less...
One moment please, your device is loading the charts...
Municipality Dorn-Dürkheim, 2019, number of rooms per house.
The percentage shows the relative share of houses per category based on the numer of rooms: 1 to 2 rooms, 3 to 4 rooms or 5 rooms or more. This is based on the total number of rooms as identified for all dwellings in the municipality Dorn-Dürkheim.
The table below shows data for more than 100 topics as most recently available for the municipality Dorn-Dürkheim. Select a category to display the related topics:
| Business | Value | Unit | Year |
|---|---|---|---|
| Businesses | no data | Number | 2015 |
| Active persons | no data | Number | 2015 |
| Gross wages | no data | Euro | 2015 |
| Dwellings | Value | Unit | Year |
|---|---|---|---|
| Houses 1 room | 2 | Number | 2019 |
| Houses 2 rooms | 10 | Number | 2019 |
| Houses 3 rooms | 41 | Number | 2019 |
| Houses 4 rooms | 63 | Number | 2019 |
| Houses 5 rooms | 116 | Number | 2019 |
| Houses 6 rooms | 72 | Number | 2019 |
| Houses 7+ rooms | 137 | Number | 2019 |
| Houses 1-2 rooms | 12 | Number | 2019 |
| Houses 3-4 rooms | 104 | Number | 2019 |
| Houses 5+ rooms | 325 | Number | 2019 |
| 1-2 rooms | 3% | Percentage | 2019 |
| 3-4 rooms | 24% | Percentage | 2019 |
| 5+ rooms | 74% | Percentage | 2019 |
| Elections | Value | Unit | Year |
|---|---|---|---|
| Voters Bundestag | 736,00 | Number | 2017 |
| Voter turnout Bundestag | 78 | Number | 2017 |
| Votes valid Bundestag | 399 | Number | 2017 |
| Votes Bundestag CDU/CSU | 125 | Number | 2017 |
| Votes Bundestag SPD | 106 | Number | 2017 |
| Votes Bundestag GRÜNE | 27 | Number | 2017 |
| Votes Bundestag FDP | 35 | Number | 2017 |
| Votes Bundestag DIE LINKE | 23 | Number | 2017 |
| Votes Bundestag AfD | 71 | Number | 2017 |
| Votes Bundestag other parties | 12 | Number | 2017 |
| Votes Bundestag total | 399 | Number | 2017 |
| % Votes Bundestag CDU/CSU | 17% | Percentage | 2017 |
| % Votes Bundestag SPD | 14% | Percentage | 2017 |
| % Votes Bundestag GRÜNE | 4% | Percentage | 2017 |
| % Votes Bundestag FDP | 5% | Percentage | 2017 |
| % Votes Bundestag DIE LINKE | 3% | Percentage | 2017 |
| % Votes Bundestag AfD | 10% | Percentage | 2017 |
| % Votes Bundestag other parties | 2% | Percentage | 2017 |
| Employment | Value | Unit | Year |
|---|---|---|---|
| Employees | 385 | Number | 2019 |
| Employees male | 206 | Number | 2019 |
| Employees female | 179 | Number | 2019 |
| Employees foreigner | 24 | Number | 2019 |
| Employees male foreigner | 0 | Number | 2019 |
| Employees female foreigner | 0 | Number | 2019 |
| Unemployed | 24 | Number | 2018 |
| Unemployed foreigners | 4 | Number | 2018 |
| Unemployed severely disabled | 0 | Number | 2018 |
| Unemployed 15-20 | 0 | Number | 2018 |
| Unemployed 15-25 | 4 | Number | 2018 |
| Unemployed 55-65 | 5 | Number | 2018 |
| Unemployed long-term | 7 | Number | 2018 |
| % Unemployed | 2% | Percentage | 2018 |
| % Unemployed foreigners | 0% | Percentage of the population | 2018 |
| % Unemployed severely disabled | 0% | Percentage of the population | 2018 |
| % Unemployed 15-20 | 0% | Percentage of the population | 2018 |
| % Unemployed 15-25 | 0% | Percentage of the population | 2018 |
| % Unemployed 55-65 | 1% | Percentage of the population | 2018 |
| % Unemployed long-term | 1% | Percentage of the population | 2018 |
| Income | Value | Unit | Year |
|---|---|---|---|
| Income receivers | 457 | Number | 2015 |
| Income total | €17.293 | Euro | 2015 |
| Income tax | €2.681 | Euro | 2015 |
| Population | Value | Unit | Year |
|---|---|---|---|
| Population | 999 | Number | 2019 |
| Men | 490 | Number | 2019 |
| Women | 509 | Number | 2019 |
| % Men | 49% | Percentage | 2019 |
| % Women | 51% | Percentage | 2019 |
| 0-18 | 194 | Number | 2019 |
| 18-30 | 116 | Number | 2019 |
| 30-45 | 181 | Number | 2019 |
| 45-60 | 252 | Number | 2019 |
| 18-60 | 549 | Number | 2019 |
| 60-75 | 167 | Number | 2019 |
| 60+ | 256 | Number | 2019 |
| Average age | 43 | Average number | 2019 |
| Average age male | 43 | Average number | 2019 |
| Average age female | 44 | Average number | 2019 |
| Births | 6 | Number | 2018 |
| Births male | 4 | Number | 2018 |
| Births female | 2 | Number | 2018 |
| 1K Births | 6 | Number per 1000 inhabitants | 2018 |
| Deaths | 11 | Number | 2018 |
| Deaths male | 3 | Number | 2018 |
| Deaths female | 8 | Number | 2018 |
| 1K Deaths | 11 | Number | 2018 |
| 0-3 | 18 | Number | 2019 |
| Girls 0-3 | 7 | Number | 2019 |
| Boys 0-3 | 11 | Number | 2019 |
| 3-6 | 37 | Number | 2019 |
| Girls 3-6 | 20 | Number | 2019 |
| Boys 3-6 | 17 | Number | 2019 |
| 6-10 | 47 | Number | 2019 |
| 10-15 | 53 | Number | 2019 |
| 15-18 | 39 | Number | 2019 |
| 18-20 | 18 | Number | 2019 |
| 20-25 | 56 | Number | 2019 |
| 25-30 | 42 | Number | 2019 |
| 30-35 | 53 | Number | 2019 |
| 35-40 | 66 | Number | 2019 |
| 40-45 | 62 | Number | 2019 |
| 45-50 | 71 | Number | 2019 |
| 50-55 | 89 | Number | 2019 |
| 55-60 | 92 | Number | 2019 |
| 60-65 | 68 | Number | 2019 |
| 65-75 | 99 | Number | 2019 |
| Women 65-70 | 46 | Number | 2019 |
| Men 65-70 | 53 | Number | 2019 |
| 75+ | 89 | Number | 2019 |
| Women 75+ | 55 | Number | 2019 |
| Men 75+ | 34 | Number | 2019 |
| % 0-10 | 10% | Percentage | 2019 |
| % 10-18 | 9% | Percentage | 2019 |
| % 18-30 | 12% | Percentage | 2019 |
| % 30-45 | 18% | Percentage | 2019 |
| % 45-60 | 25% | Percentage | 2019 |
| % 60+ | 26% | Percentage | 2019 |
| Real estate | Value | Unit | Year |
|---|---|---|---|
| Property tax A revenue | no data | Euro | no data |
| Property tax B revenue | no data | Euro | no data |
| Trade tax actual revenue | no data | Euro | no data |
| Property tax A basic amount | no data | Euro | no data |
| Property tax B basic amount | no data | Euro | no data |
| Trade tax basic amount | no data | Euro | no data |
| Property tax A rate | €330 | Euro | 2018 |
| Property tax B rate | no data | Euro | no data |
| Trade tax rate | no data | Euro | no data |
| Real tax raising force | no data | Euro | no data |
| Trade tax levy | €18.933 | Euro | 2018 |
| Trade tax net | €82.245 | Euro | 2018 |
| Community share in income tax | no data | Euro | no data |
| Community share in sales tax | no data | Euro | no data |
| Tax revenue | no data | Euro | no data |
| Regional | Value | Unit | Year |
|---|---|---|---|
| Region code | 073395007201 | Code | 2019 |
| Region code 8 digits | 07339201 | Code | 07339201 |
| Sorting code | 073395007201 | Code | 073395007201 |
| Sorting code 8 digits | 07339201 | Code | 07339201 |
| Region name | Dorn-Dürkheim | Name | 2019 |
| Regional level | 6 | Categorical type | 2019 |
| Region type | Municipality | Categorical type | 2019 |
| Region type detail | municipality | Categorical type | 2019 |
| Region name with type | municipality Dorn-Dürkheim | Name | 2019 |
| Region name in German | Gemeinde Dorn-Dürkheim | Name | 2019 |
| Direct subregions | no data | Number | 2019 |
| NUTS code | DEB3J | Code | 2019 |
| Area | 6 | Area in km² | 2019 |
| Religion | Value | Unit | Year |
|---|---|---|---|
| Roman Catholic church | 210 | Number | 2011 |
| Protestant church | 488 | Number | 2011 |
| Other or none | 245 | Number | 2011 |
| % Roman Catholic church | 22% | Percentage | 2011 |
| % Protestant church | 52% | Percentage | 2011 |
| % Other or none | 26% | Percentage | 2011 |
| Roman Catholic church German | 196 | Number | 2011 |
| Protestant church German | 488 | Number | 2011 |
| Other or none German | 220 | Number | 2011 |
| % Roman Catholic church German | 22% | Percentage | 2011 |
| % Protestant church German | 54% | Percentage | 2011 |
| % Other or none German Foreign | 24% | Percentage | 2011 |
| Roman Catholic church Foreign | 14 | Number | 2011 |
| Protestant church Foreign | 0 | Number | 2011 |
| Other or none Foreign | 25 | Number | 2011 |
| % Roman Catholic church Foreign | 36% | Percentage | 2011 |
| % Protestant church Foreign | 0% | Percentage | 2011 |
| % Other or none Foreign | 64% | Percentage | 2011 |
Data is used from multiple German open data providers. See this description of the sources with the definitions of all regional topics.
Sources & definitionsThis page will be further expanded with more topics in clear graphs. This will be done in several iterations in the coming weeks.
![]()
© Published:
 Contents and more information: