Population numbers per year
The number of inhabitants in the municipality city Idar-Oberstein
One moment please, your device is loading the charts...
Population numbers in the municipality city Idar-Oberstein for the years 2009 thru 2019.
The number of inhabitants is the number of persons as registered in the population register on January 1st.
Population at the map of Idar-Oberstein
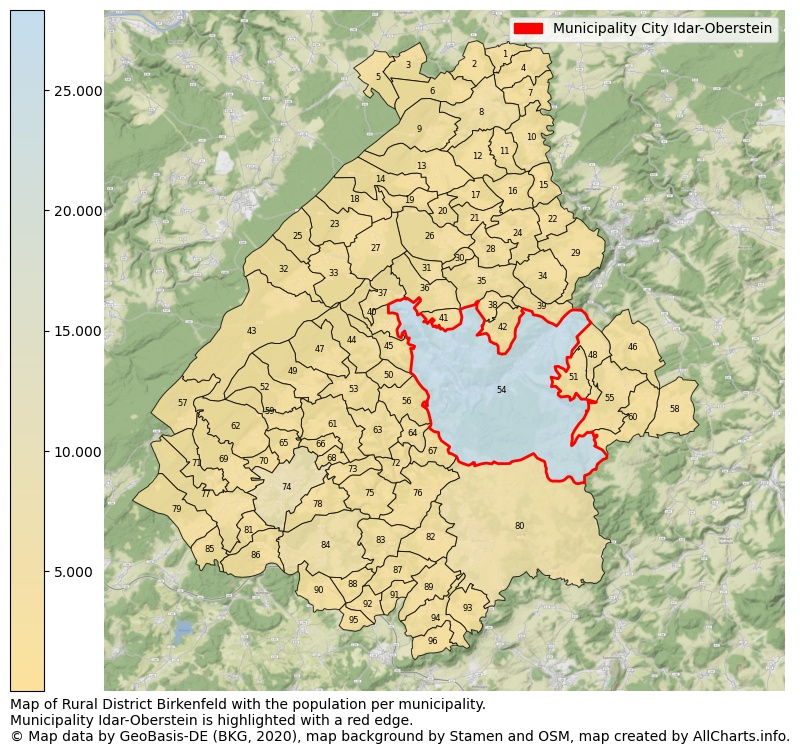
Map of Rural district Birkenfeld with the population per municipality.Municipality Idar-Oberstein is highlighted with a red edge. The numbers at the map represent the following municipalities: 1: municipality Schwerbach, 2: municipality Gösenroth, 3: municipality Krummenau, 4: municipality Oberkirn, 5: municipality Horbruch ...Show more... Map of Rural district Birkenfeld with the population per municipality.Municipality Idar-Oberstein is highlighted with a red edge. The numbers at the map represent the following municipalities: 1: municipality Schwerbach, 2: municipality Gösenroth, 3: municipality Krummenau, 4: municipality Oberkirn, 5: municipality Horbruch, 6: municipality Weitersbach, 7: municipality Hausen, 8: municipality Rhaunen, 9: municipality Stipshausen, 10: municipality Bundenbach, 11: municipality Bollenbach, 12: municipality Sulzbach, 13: municipality Hottenbach, 14: municipality Hellertshausen, 15: municipality Sonnschied, 16: municipality Wickenrodt, 17: municipality Oberhosenbach, 18: municipality Schauren, 19: municipality Asbach, 20: municipality Weiden, 21: municipality Breitenthal, 22: municipality Griebelschied, 23: municipality Bruchweiler, 24: municipality Niederhosenbach, 25: municipality Langweiler, 26: municipality Mörschied, 27: municipality Kempfeld, 28: municipality Herrstein, 29: municipality Bergen, 30: municipality Oberwörresbach, 31: municipality Herborn, 32: municipality Wirschweiler, 33: municipality Sensweiler, 34: municipality Berschweiler bei Kirn, 35: municipality Niederwörresbach, 36: municipality Veitsrodt, 37: municipality Kirschweiler, 38: municipality Gerach, 39: municipality Fischbach, 40: municipality Hettenrodt, 41: municipality Vollmersbach, 42: municipality Hintertiefenbach, 43: municipality Allenbach, 44: municipality Siesbach, 45: municipality Mackenrodt, 46: municipality Schmidthachenbach, 47: municipality Leisel, 48: municipality Mittelreidenbach, 49: municipality Schwollen, 50: municipality Rötsweiler-Nockenthal, 51: municipality Dickesbach, 52: municipality Hattgenstein, 53: municipality Wilzenberg-Hußweiler, 54: municipality city Idar-Oberstein, 55: municipality Oberreidenbach, 56: municipality Oberbrombach, 57: municipality Börfink, 58: municipality Sien, 59: municipality Oberhambach, 60: municipality Sienhachenbach, 61: municipality Niederhambach, 62: municipality Rinzenberg, 63: municipality Niederbrombach, 64: municipality Sonnenberg-Winnenberg, 65: municipality Gollenberg, 66: municipality Elchweiler, 67: municipality Frauenberg, 68: municipality Schmißberg, 69: municipality Buhlenberg, 70: municipality Ellenberg, 71: municipality Abentheuer, 72: municipality Kronweiler, 73: municipality Rimsberg, 74: municipality city Birkenfeld, 75: municipality Nohen, 76: municipality Reichenbach, 77: municipality Brücken, 78: municipality Dienstweiler, 79: municipality Achtelsbach, 80: municipality city Baumholder, 81: municipality Dambach, 82: municipality Ruschberg, 83: municipality Heimbach, 84: municipality Hoppstädten-Weiersbach, 85: municipality Meckenbach, 86: municipality Ellweiler, 87: municipality Berglangenbach, 88: municipality Leitzweiler, 89: municipality Fohren-Linden, 90: municipality Gimbweiler, 91: municipality Rohrbach, 92: municipality Rückweiler, 93: municipality Mettweiler, 94: municipality Berschweiler bei Baumholder, 95: municipality Hahnweiler, 96: municipality Eckersweiler ...Show less...
The number of rooms per house (dwelling)
The number of rooms of the houses in the municipality city Idar-Oberstein
One moment please, your device is loading the charts...
Municipality city Idar-Oberstein, 2019, number of rooms per house.
The percentage shows the relative share of houses per category based on the numer of rooms: 1 to 2 rooms, 3 to 4 rooms or 5 rooms or more. This is based on the total number of rooms as identified for all dwellings in the municipality city Idar-Oberstein.
Data about more than 100 topics!
The table below shows data for more than 100 topics as most recently available for the municipality city Idar-Oberstein. Select a category to display the related topics:
| Business | Value | Unit | Year |
|---|---|---|---|
| Businesses | 32 | Number | 2017 |
| Active persons | 3.132 | Number | 2017 |
| Gross wages | €109.690 | Euro | 2017 |
| Dwellings | Value | Unit | Year |
|---|---|---|---|
| Houses 1 room | 404 | Number | 2019 |
| Houses 2 rooms | 840 | Number | 2019 |
| Houses 3 rooms | 2.744 | Number | 2019 |
| Houses 4 rooms | 4.110 | Number | 2019 |
| Houses 5 rooms | 2.834 | Number | 2019 |
| Houses 6 rooms | 2.321 | Number | 2019 |
| Houses 7+ rooms | 3.587 | Number | 2019 |
| Houses 1-2 rooms | 1.244 | Number | 2019 |
| Houses 3-4 rooms | 6.854 | Number | 2019 |
| Houses 5+ rooms | 8.742 | Number | 2019 |
| 1-2 rooms | 7% | Percentage | 2019 |
| 3-4 rooms | 41% | Percentage | 2019 |
| 5+ rooms | 52% | Percentage | 2019 |
| Elections | Value | Unit | Year |
|---|---|---|---|
| Voters Bundestag | 23423,00 | Number | 2017 |
| Voter turnout Bundestag | 70 | Number | 2017 |
| Votes valid Bundestag | 16.077 | Number | 2017 |
| Votes Bundestag CDU/CSU | 5.310 | Number | 2017 |
| Votes Bundestag SPD | 4.578 | Number | 2017 |
| Votes Bundestag GRÜNE | 779 | Number | 2017 |
| Votes Bundestag FDP | 1.566 | Number | 2017 |
| Votes Bundestag DIE LINKE | 1.162 | Number | 2017 |
| Votes Bundestag AfD | 2.173 | Number | 2017 |
| Votes Bundestag other parties | 509 | Number | 2017 |
| Votes Bundestag total | 16.077 | Number | 2017 |
| % Votes Bundestag CDU/CSU | 23% | Percentage | 2017 |
| % Votes Bundestag SPD | 20% | Percentage | 2017 |
| % Votes Bundestag GRÜNE | 3% | Percentage | 2017 |
| % Votes Bundestag FDP | 7% | Percentage | 2017 |
| % Votes Bundestag DIE LINKE | 5% | Percentage | 2017 |
| % Votes Bundestag AfD | 9% | Percentage | 2017 |
| % Votes Bundestag other parties | 2% | Percentage | 2017 |
| Employment | Value | Unit | Year |
|---|---|---|---|
| Employees | 10.601 | Number | 2019 |
| Employees male | 5.693 | Number | 2019 |
| Employees female | 4.908 | Number | 2019 |
| Employees foreigner | 919 | Number | 2019 |
| Employees male foreigner | 596 | Number | 2019 |
| Employees female foreigner | 323 | Number | 2019 |
| Unemployed | 1.258 | Number | 2018 |
| Unemployed foreigners | 238 | Number | 2018 |
| Unemployed severely disabled | 85 | Number | 2018 |
| Unemployed 15-20 | 29 | Number | 2018 |
| Unemployed 15-25 | 132 | Number | 2018 |
| Unemployed 55-65 | 274 | Number | 2018 |
| Unemployed long-term | 570 | Number | 2018 |
| % Unemployed | 4% | Percentage | 2018 |
| % Unemployed foreigners | 1% | Percentage of the population | 2018 |
| % Unemployed severely disabled | 0% | Percentage of the population | 2018 |
| % Unemployed 15-20 | 0% | Percentage of the population | 2018 |
| % Unemployed 15-25 | 0% | Percentage of the population | 2018 |
| % Unemployed 55-65 | 1% | Percentage of the population | 2018 |
| % Unemployed long-term | 2% | Percentage of the population | 2018 |
| Income | Value | Unit | Year |
|---|---|---|---|
| Income receivers | 13.425 | Number | 2015 |
| Income total | €446.136 | Euro | 2015 |
| Income tax | €69.827 | Euro | 2015 |
| Population | Value | Unit | Year |
|---|---|---|---|
| Population | 28.323 | Number | 2019 |
| Men | 13.828 | Number | 2019 |
| Women | 14.495 | Number | 2019 |
| % Men | 49% | Percentage | 2019 |
| % Women | 51% | Percentage | 2019 |
| 0-18 | 4.246 | Number | 2019 |
| 18-30 | 3.625 | Number | 2019 |
| 30-45 | 4.361 | Number | 2019 |
| 45-60 | 6.468 | Number | 2019 |
| 18-60 | 14.454 | Number | 2019 |
| 60-75 | 5.661 | Number | 2019 |
| 60+ | 9.623 | Number | 2019 |
| Average age | 47 | Average number | 2019 |
| Average age male | 46 | Average number | 2019 |
| Average age female | 49 | Average number | 2019 |
| Births | 228 | Number | 2018 |
| Births male | 119 | Number | 2018 |
| Births female | 109 | Number | 2018 |
| 1K Births | 8 | Number per 1000 inhabitants | 2018 |
| Deaths | 461 | Number | 2018 |
| Deaths male | 235 | Number | 2018 |
| Deaths female | 226 | Number | 2018 |
| 1K Deaths | 16 | Number | 2018 |
| 0-3 | 797 | Number | 2019 |
| Girls 0-3 | 394 | Number | 2019 |
| Boys 0-3 | 403 | Number | 2019 |
| 3-6 | 753 | Number | 2019 |
| Girls 3-6 | 390 | Number | 2019 |
| Boys 3-6 | 363 | Number | 2019 |
| 6-10 | 913 | Number | 2019 |
| 10-15 | 1.093 | Number | 2019 |
| 15-18 | 690 | Number | 2019 |
| 18-20 | 558 | Number | 2019 |
| 20-25 | 1.355 | Number | 2019 |
| 25-30 | 1.712 | Number | 2019 |
| 30-35 | 1.570 | Number | 2019 |
| 35-40 | 1.413 | Number | 2019 |
| 40-45 | 1.378 | Number | 2019 |
| 45-50 | 1.693 | Number | 2019 |
| 50-55 | 2.243 | Number | 2019 |
| 55-60 | 2.532 | Number | 2019 |
| 60-65 | 2.264 | Number | 2019 |
| 65-75 | 3.397 | Number | 2019 |
| Women 65-70 | 1.822 | Number | 2019 |
| Men 65-70 | 1.575 | Number | 2019 |
| 75+ | 3.962 | Number | 2019 |
| Women 75+ | 2.347 | Number | 2019 |
| Men 75+ | 1.615 | Number | 2019 |
| % 0-10 | 9% | Percentage | 2019 |
| % 10-18 | 6% | Percentage | 2019 |
| % 18-30 | 13% | Percentage | 2019 |
| % 30-45 | 15% | Percentage | 2019 |
| % 45-60 | 23% | Percentage | 2019 |
| % 60+ | 34% | Percentage | 2019 |
| Real estate | Value | Unit | Year |
|---|---|---|---|
| Property tax A revenue | €13.134 | Euro | 2018 |
| Property tax B revenue | €4.648.991 | Euro | 2018 |
| Trade tax actual revenue | €15.241.677 | Euro | 2018 |
| Property tax A basic amount | €3.863 | Euro | 2018 |
| Property tax B basic amount | €1.081.161 | Euro | 2018 |
| Trade tax basic amount | €3.810.419 | Euro | 2018 |
| Property tax A rate | €340 | Euro | 2018 |
| Property tax B rate | €430 | Euro | 2018 |
| Trade tax rate | €400 | Euro | 2018 |
| Real tax raising force | €20.439.839 | Euro | 2018 |
| Trade tax levy | €2.602.516 | Euro | 2018 |
| Trade tax net | €12.639.161 | Euro | 2018 |
| Community share in income tax | €10.144.744 | Euro | 2018 |
| Community share in sales tax | €2.659.064 | Euro | 2018 |
| Tax revenue | €30.641.131 | Euro | 2018 |
| Regional | Value | Unit | Year |
|---|---|---|---|
| Region code | 071340045045 | Code | 2019 |
| Region code 8 digits | 07134045 | Code | 07134045 |
| Sorting code | 071340045045 | Code | 071340045045 |
| Sorting code 8 digits | 07134045 | Code | 07134045 |
| Region name | Idar-Oberstein | Name | 2019 |
| Regional level | 6 | Categorical type | 2019 |
| Region type | Municipality | Categorical type | 2019 |
| Region type detail | municipality city | Categorical type | 2019 |
| Region name with type | municipality city Idar-Oberstein | Name | 2019 |
| Region name in German | Gemeinde Stadt Idar-Oberstein | Name | 2019 |
| Direct subregions | no data | Number | 2019 |
| NUTS code | DEB15 | Code | 2019 |
| Area | 92 | Area in km² | 2019 |
| Religion | Value | Unit | Year |
|---|---|---|---|
| Roman Catholic church | 5.276 | Number | 2011 |
| Protestant church | 16.332 | Number | 2011 |
| Other or none | 7.465 | Number | 2011 |
| % Roman Catholic church | 18% | Percentage | 2011 |
| % Protestant church | 56% | Percentage | 2011 |
| % Other or none | 26% | Percentage | 2011 |
| Roman Catholic church German | 4.985 | Number | 2011 |
| Protestant church German | 16.244 | Number | 2011 |
| Other or none German | 6.642 | Number | 2011 |
| % Roman Catholic church German | 18% | Percentage | 2011 |
| % Protestant church German | 58% | Percentage | 2011 |
| % Other or none German Foreign | 24% | Percentage | 2011 |
| Roman Catholic church Foreign | 291 | Number | 2011 |
| Protestant church Foreign | 88 | Number | 2011 |
| Other or none Foreign | 823 | Number | 2011 |
| % Roman Catholic church Foreign | 24% | Percentage | 2011 |
| % Protestant church Foreign | 7% | Percentage | 2011 |
| % Other or none Foreign | 68% | Percentage | 2011 |
Open data sources used
Data is used from multiple German open data providers. See this description of the sources with the definitions of all regional topics.
Sources & definitionsUnder development
Work is in progress to add more information to this page
This page will be further expanded with more topics in clear graphs. This will be done in several iterations in the coming weeks.