Population numbers per year
The number of inhabitants in the municipality Hinzert-Pölert
One moment please, your device is loading the charts...
Population numbers in the municipality Hinzert-Pölert for the years 2009 thru 2019.
The number of inhabitants is the number of persons as registered in the population register on January 1st.
Population at the map of Hinzert-Pölert
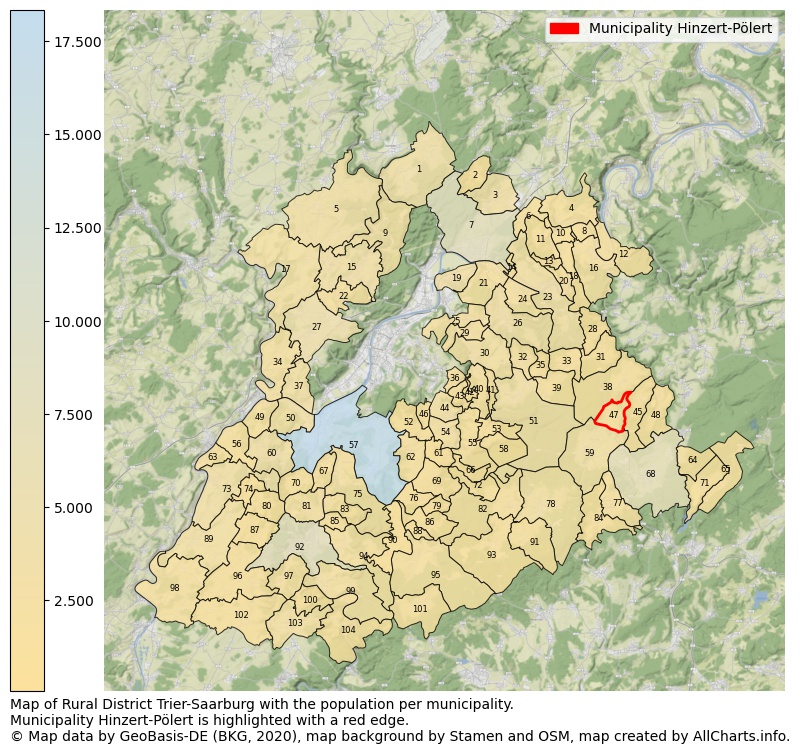
Map of Rural district Trier-Saarburg with the population per municipality.Municipality Hinzert-Pölert is highlighted with a red edge. The numbers at the map represent the following municipalities: 1: municipality Zemmer, 2: municipality Naurath (Eifel), 3: municipality Föhren, 4: municipality Klüsserath, 5: municipality Welschbillig ...Show more... Map of Rural district Trier-Saarburg with the population per municipality.Municipality Hinzert-Pölert is highlighted with a red edge. The numbers at the map represent the following municipalities: 1: municipality Zemmer, 2: municipality Naurath (Eifel), 3: municipality Föhren, 4: municipality Klüsserath, 5: municipality Welschbillig, 6: municipality Bekond, 7: municipality city Schweich, 8: municipality Köwerich, 9: municipality Kordel, 10: municipality Thörnich, 11: municipality Ensch, 12: municipality Trittenheim, 13: municipality Schleich, 14: municipality Longen, 15: municipality Newel, 16: municipality Leiwen, 17: municipality Ralingen, 18: municipality Detzem, 19: municipality Kenn, 20: municipality Pölich, 21: municipality Longuich, 22: municipality Aach, 23: municipality Mehring, 24: municipality Riol, 25: municipality Mertesdorf, 26: municipality Fell, 27: municipality Trierweiler, 28: municipality Naurath (Wald), 29: municipality Kasel, 30: municipality Waldrach, 31: municipality Bescheid, 32: municipality Thomm, 33: municipality Lorscheid, 34: municipality Langsur, 35: municipality Herl, 36: municipality Korlingen, 37: municipality Igel, 38: municipality Beuren (Hochwald), 39: municipality Farschweiler, 40: municipality Morscheid, 41: municipality Riveris, 42: municipality Sommerau, 43: municipality Gutweiler, 44: municipality Gusterath, 45: municipality Rascheid, 46: municipality Hockweiler, 47: municipality Hinzert-Pölert, 48: municipality Geisfeld, 49: municipality Oberbillig, 50: municipality Wasserliesch, 51: municipality Osburg, 52: municipality Franzenheim, 53: municipality Bonerath, 54: municipality Pluwig, 55: municipality Schöndorf, 56: municipality Temmels, 57: municipality city Konz, 58: municipality Holzerath, 59: municipality Reinsfeld, 60: municipality Tawern, 61: municipality Ollmuth, 62: municipality Pellingen, 63: municipality Wellen, 64: municipality Damflos, 65: municipality Neuhütten, 66: municipality Hinzenburg, 67: municipality Kanzem, 68: municipality city Hermeskeil, 69: municipality Lampaden, 70: municipality Wawern, 71: municipality Züsch, 72: municipality Heddert, 73: municipality Nittel, 74: municipality Onsdorf, 75: municipality Wiltingen, 76: municipality Paschel, 77: municipality Gusenburg, 78: municipality Kell am See, 79: municipality Schömerich, 80: municipality Mannebach, 81: municipality Ayl, 82: municipality Schillingen, 83: municipality Schoden, 84: municipality Grimburg, 85: municipality Ockfen, 86: municipality Hentern, 87: municipality Fisch, 88: municipality Baldringen, 89: municipality Wincheringen, 90: municipality Vierherrenborn, 91: municipality Waldweiler, 92: municipality city Saarburg, 93: municipality Mandern, 94: municipality Irsch, 95: municipality Zerf, 96: municipality Merzkirchen, 97: municipality Trassem, 98: municipality Palzem, 99: municipality Serrig, 100: municipality Kastel-Staadt, 101: municipality Greimerath, 102: municipality Kirf, 103: municipality Freudenburg, 104: municipality Taben-Rodt ...Show less...
The number of rooms per house (dwelling)
The number of rooms of the houses in the municipality Hinzert-Pölert
One moment please, your device is loading the charts...
Municipality Hinzert-Pölert, 2019, number of rooms per house.
The percentage shows the relative share of houses per category based on the numer of rooms: 1 to 2 rooms, 3 to 4 rooms or 5 rooms or more. This is based on the total number of rooms as identified for all dwellings in the municipality Hinzert-Pölert.
Data about more than 100 topics!
The table below shows data for more than 100 topics as most recently available for the municipality Hinzert-Pölert. Select a category to display the related topics:
| Business | Value | Unit | Year |
|---|---|---|---|
| Businesses | no data | Number | 2015 |
| Active persons | no data | Number | 2015 |
| Gross wages | no data | Euro | 2015 |
| Dwellings | Value | Unit | Year |
|---|---|---|---|
| Houses 1 room | 0 | Number | 2019 |
| Houses 2 rooms | 0 | Number | 2019 |
| Houses 3 rooms | 5 | Number | 2019 |
| Houses 4 rooms | 23 | Number | 2019 |
| Houses 5 rooms | 32 | Number | 2019 |
| Houses 6 rooms | 33 | Number | 2019 |
| Houses 7+ rooms | 45 | Number | 2019 |
| Houses 1-2 rooms | 0 | Number | 2019 |
| Houses 3-4 rooms | 28 | Number | 2019 |
| Houses 5+ rooms | 110 | Number | 2019 |
| 1-2 rooms | 0% | Percentage | 2019 |
| 3-4 rooms | 20% | Percentage | 2019 |
| 5+ rooms | 80% | Percentage | 2019 |
| Elections | Value | Unit | Year |
|---|---|---|---|
| Voters Bundestag | 227,00 | Number | 2017 |
| Voter turnout Bundestag | 86 | Number | 2017 |
| Votes valid Bundestag | 150 | Number | 2017 |
| Votes Bundestag CDU/CSU | 60 | Number | 2017 |
| Votes Bundestag SPD | 33 | Number | 2017 |
| Votes Bundestag GRÜNE | 7 | Number | 2017 |
| Votes Bundestag FDP | 12 | Number | 2017 |
| Votes Bundestag DIE LINKE | 13 | Number | 2017 |
| Votes Bundestag AfD | 20 | Number | 2017 |
| Votes Bundestag other parties | 5 | Number | 2017 |
| Votes Bundestag total | 150 | Number | 2017 |
| % Votes Bundestag CDU/CSU | 26% | Percentage | 2017 |
| % Votes Bundestag SPD | 15% | Percentage | 2017 |
| % Votes Bundestag GRÜNE | 3% | Percentage | 2017 |
| % Votes Bundestag FDP | 5% | Percentage | 2017 |
| % Votes Bundestag DIE LINKE | 6% | Percentage | 2017 |
| % Votes Bundestag AfD | 9% | Percentage | 2017 |
| % Votes Bundestag other parties | 2% | Percentage | 2017 |
| Employment | Value | Unit | Year |
|---|---|---|---|
| Employees | 130 | Number | 2019 |
| Employees male | 73 | Number | 2019 |
| Employees female | 57 | Number | 2019 |
| Employees foreigner | 0 | Number | 2019 |
| Employees male foreigner | 0 | Number | 2019 |
| Employees female foreigner | 0 | Number | 2019 |
| Unemployed | 4 | Number | 2018 |
| Unemployed foreigners | 0 | Number | 2018 |
| Unemployed severely disabled | 0 | Number | 2018 |
| Unemployed 15-20 | 0 | Number | 2018 |
| Unemployed 15-25 | 0 | Number | 2018 |
| Unemployed 55-65 | 1 | Number | 2018 |
| Unemployed long-term | 1 | Number | 2018 |
| % Unemployed | 1% | Percentage | 2018 |
| % Unemployed foreigners | 0% | Percentage of the population | 2018 |
| % Unemployed severely disabled | 0% | Percentage of the population | 2018 |
| % Unemployed 15-20 | 0% | Percentage of the population | 2018 |
| % Unemployed 15-25 | 0% | Percentage of the population | 2018 |
| % Unemployed 55-65 | 0% | Percentage of the population | 2018 |
| % Unemployed long-term | 0% | Percentage of the population | 2018 |
| Income | Value | Unit | Year |
|---|---|---|---|
| Income receivers | 137 | Number | 2015 |
| Income total | €4.991 | Euro | 2015 |
| Income tax | €809 | Euro | 2015 |
| Population | Value | Unit | Year |
|---|---|---|---|
| Population | 288 | Number | 2019 |
| Men | 139 | Number | 2019 |
| Women | 149 | Number | 2019 |
| % Men | 48% | Percentage | 2019 |
| % Women | 52% | Percentage | 2019 |
| 0-18 | 51 | Number | 2019 |
| 18-30 | 34 | Number | 2019 |
| 30-45 | 52 | Number | 2019 |
| 45-60 | 86 | Number | 2019 |
| 18-60 | 172 | Number | 2019 |
| 60-75 | 35 | Number | 2019 |
| 60+ | 65 | Number | 2019 |
| Average age | 44 | Average number | 2019 |
| Average age male | 45 | Average number | 2019 |
| Average age female | 42 | Average number | 2019 |
| Births | 3 | Number | 2018 |
| Births male | 1 | Number | 2018 |
| Births female | 2 | Number | 2018 |
| 1K Births | 10 | Number per 1000 inhabitants | 2018 |
| Deaths | 2 | Number | 2018 |
| Deaths male | 1 | Number | 2018 |
| Deaths female | 1 | Number | 2018 |
| 1K Deaths | 7 | Number | 2018 |
| 0-3 | 9 | Number | 2019 |
| Girls 0-3 | 6 | Number | 2019 |
| Boys 0-3 | 3 | Number | 2019 |
| 3-6 | 12 | Number | 2019 |
| Girls 3-6 | 6 | Number | 2019 |
| Boys 3-6 | 6 | Number | 2019 |
| 6-10 | 14 | Number | 2019 |
| 10-15 | 9 | Number | 2019 |
| 15-18 | 7 | Number | 2019 |
| 18-20 | 10 | Number | 2019 |
| 20-25 | 12 | Number | 2019 |
| 25-30 | 12 | Number | 2019 |
| 30-35 | 13 | Number | 2019 |
| 35-40 | 19 | Number | 2019 |
| 40-45 | 20 | Number | 2019 |
| 45-50 | 21 | Number | 2019 |
| 50-55 | 26 | Number | 2019 |
| 55-60 | 39 | Number | 2019 |
| 60-65 | 13 | Number | 2019 |
| 65-75 | 22 | Number | 2019 |
| Women 65-70 | 11 | Number | 2019 |
| Men 65-70 | 11 | Number | 2019 |
| 75+ | 30 | Number | 2019 |
| Women 75+ | 16 | Number | 2019 |
| Men 75+ | 14 | Number | 2019 |
| % 0-10 | 12% | Percentage | 2019 |
| % 10-18 | 6% | Percentage | 2019 |
| % 18-30 | 12% | Percentage | 2019 |
| % 30-45 | 18% | Percentage | 2019 |
| % 45-60 | 30% | Percentage | 2019 |
| % 60+ | 23% | Percentage | 2019 |
| Real estate | Value | Unit | Year |
|---|---|---|---|
| Property tax A revenue | €3.447 | Euro | 2018 |
| Property tax B revenue | no data | Euro | no data |
| Trade tax actual revenue | €44.335 | Euro | 2018 |
| Property tax A basic amount | no data | Euro | no data |
| Property tax B basic amount | €4.668 | Euro | 2018 |
| Trade tax basic amount | €12.147 | Euro | 2018 |
| Property tax A rate | €400 | Euro | 2018 |
| Property tax B rate | no data | Euro | no data |
| Trade tax rate | €365 | Euro | 2018 |
| Real tax raising force | no data | Euro | no data |
| Trade tax levy | €8.296 | Euro | 2018 |
| Trade tax net | €36.039 | Euro | 2018 |
| Community share in income tax | no data | Euro | no data |
| Community share in sales tax | no data | Euro | no data |
| Tax revenue | €186.157 | Euro | 2018 |
| Regional | Value | Unit | Year |
|---|---|---|---|
| Region code | 072355001047 | Code | 2019 |
| Region code 8 digits | 07235047 | Code | 07235047 |
| Sorting code | 072355001047 | Code | 072355001047 |
| Sorting code 8 digits | 07235047 | Code | 07235047 |
| Region name | Hinzert-Pölert | Name | 2019 |
| Regional level | 6 | Categorical type | 2019 |
| Region type | Municipality | Categorical type | 2019 |
| Region type detail | municipality | Categorical type | 2019 |
| Region name with type | municipality Hinzert-Pölert | Name | 2019 |
| Region name in German | Gemeinde Hinzert-Pölert | Name | 2019 |
| Direct subregions | no data | Number | 2019 |
| NUTS code | DEB25 | Code | 2019 |
| Area | 5 | Area in km² | 2019 |
| Religion | Value | Unit | Year |
|---|---|---|---|
| Roman Catholic church | 234 | Number | 2011 |
| Protestant church | 18 | Number | 2011 |
| Other or none | 34 | Number | 2011 |
| % Roman Catholic church | 82% | Percentage | 2011 |
| % Protestant church | 6% | Percentage | 2011 |
| % Other or none | 12% | Percentage | 2011 |
| Roman Catholic church German | 234 | Number | 2011 |
| Protestant church German | 18 | Number | 2011 |
| Other or none German | 34 | Number | 2011 |
| % Roman Catholic church German | 82% | Percentage | 2011 |
| % Protestant church German | 6% | Percentage | 2011 |
| % Other or none German Foreign | 12% | Percentage | 2011 |
| Roman Catholic church Foreign | 0 | Number | 2011 |
| Protestant church Foreign | 0 | Number | 2011 |
| Other or none Foreign | 0 | Number | 2011 |
| % Roman Catholic church Foreign | no data | Percentage | no data |
| % Protestant church Foreign | no data | Percentage | no data |
| % Other or none Foreign | no data | Percentage | no data |
Open data sources used
Data is used from multiple German open data providers. See this description of the sources with the definitions of all regional topics.
Sources & definitionsUnder development
Work is in progress to add more information to this page
This page will be further expanded with more topics in clear graphs. This will be done in several iterations in the coming weeks.