Population numbers per year
The number of inhabitants in the free state Bavaria
One moment please, your device is loading the charts...
Population numbers in the free state Bavaria for the years 2009 thru 2019.
The number of inhabitants is the number of persons as registered in the population register on January 1st.
Population at the map of Bavaria (Bayern)
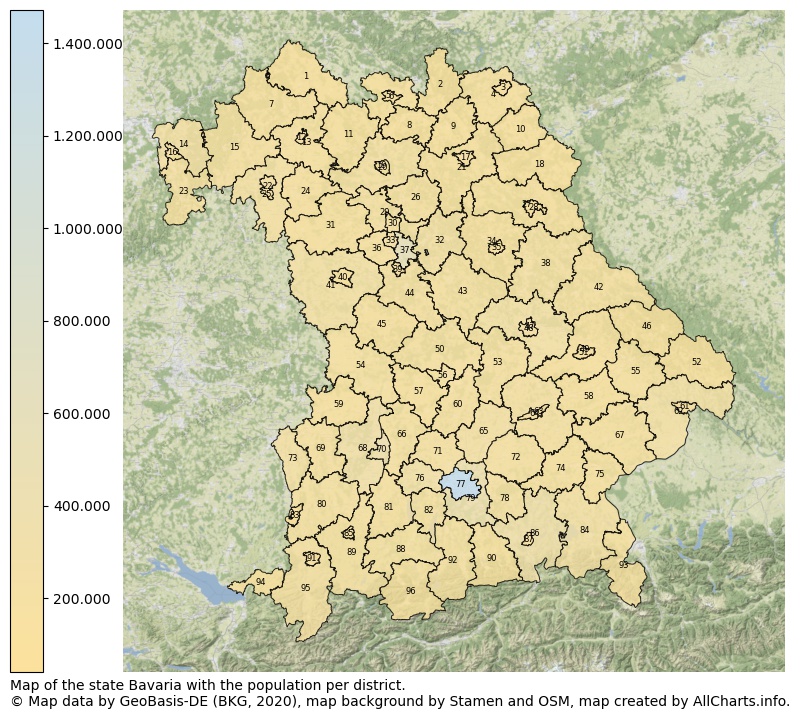
Map of the state Bavaria with the population per district. The numbers at the map represent the following districts: 1: rural district Rhön-Grabfeld, 2: rural district Kronach, 3: independent city district Hof, 4: rural district Hof, 5: rural district Coburg ...Show more... Map of the state Bavaria with the population per district. The numbers at the map represent the following districts: 1: rural district Rhön-Grabfeld, 2: rural district Kronach, 3: independent city district Hof, 4: rural district Hof, 5: rural district Coburg, 6: independent city district Coburg, 7: rural district Bad Kissingen, 8: rural district Lichtenfels, 9: rural district Kulmbach, 10: rural district Wunsiedel i. Fichtelgebirge, 11: rural district Haßberge, 12: independent city district Schweinfurt, 13: rural district Schweinfurt, 14: rural district Aschaffenburg, 15: rural district Main-Spessart, 16: independent city district Aschaffenburg, 17: independent city district Bayreuth, 18: rural district Tirschenreuth, 19: rural district Bamberg, 20: independent city district Bamberg, 21: rural district Bayreuth, 22: independent city district Würzburg, 23: rural district Miltenberg, 24: rural district Kitzingen, 25: rural district Würzburg, 26: rural district Forchheim, 27: rural district Neustadt a.d. Waldnaab, 28: independent city district Weiden i.d. OPf., 29: rural district Erlangen-Höchstadt, 30: independent city district Erlangen, 31: rural district Neustadt a.d. Aisch-Bad Windsheim, 32: rural district Nürnberger Land, 33: independent city district Fürth, 34: rural district Amberg-Sulzbach, 35: independent city district Amberg, 36: rural district Fürth, 37: independent city district Nuremberg, 38: rural district Schwandorf, 39: independent city district Schwabach, 40: independent city district Ansbach, 41: rural district Ansbach, 42: rural district Cham, 43: rural district Neumarkt i.d. OPf., 44: rural district Roth, 45: rural district Weißenburg-Gunzenhausen, 46: rural district Regen, 47: rural district Regensburg, 48: independent city district Regensburg, 49: rural district Straubing-Bogen, 50: rural district Eichstätt, 51: independent city district Straubing, 52: rural district Freyung-Grafenau, 53: rural district Kelheim, 54: rural district Donau-Ries, 55: rural district Deggendorf, 56: independent city district Ingolstadt, 57: rural district Neuburg-Schrobenhausen, 58: rural district Dingolfing-Landau, 59: rural district Dillingen a.d. Donau, 60: rural district Pfaffenhofen a.d. Ilm, 61: independent city district Passaw, 62: rural district Passaw, 63: rural district Landshut, 64: independent city district Landshut, 65: rural district Freising, 66: rural district Aichach-Friedberg, 67: rural district Rottal-Inn, 68: rural district Augsburg, 69: rural district Günzburg, 70: independent city district Augsburg, 71: rural district Dachau, 72: rural district Erding, 73: rural district Neu-Ulm, 74: rural district Mühldorf a. Inn, 75: rural district Altötting, 76: rural district Fürstenfeldbruck, 77: independent city district Munich, 78: rural district Ebersberg, 79: rural district Munich, 80: rural district Unterallgäu, 81: rural district Landsberg am Lech, 82: rural district Starnberg, 83: independent city district Memmingen, 84: rural district Traunstein, 85: independent city district Kaufbeuren, 86: rural district Rosenheim, 87: independent city district Rosenheim, 88: rural district Weilheim-Schongau, 89: rural district Ostallgäu, 90: rural district Miesbach, 91: independent city district Kempten (Allgäu), 92: rural district Bad Tölz-Wolfratshausen, 93: rural district Berchtesgadener Land, 94: rural district Lindau (Bodensee), 95: rural district Oberallgäu, 96: rural district Garmisch-Partenkirchen ...Show less...
The number of rooms per house (dwelling)
The number of rooms of the houses in the free state Bavaria
One moment please, your device is loading the charts...
Free state Bavaria, 2019, number of rooms per house.
The percentage shows the relative share of houses per category based on the numer of rooms: 1 to 2 rooms, 3 to 4 rooms or 5 rooms or more. This is based on the total number of rooms as identified for all dwellings in the free state Bavaria.
Data about more than 100 topics!
The table below shows data for more than 100 topics as most recently available for the free state Bavaria. Select a category to display the related topics:
| Business | Value | Unit | Year |
|---|---|---|---|
| Businesses | 7.408 | Number | 2017 |
| Active persons | 1.294.760 | Number | 2017 |
| Gross wages | €66.744.806 | Euro | 2017 |
| Dwellings | Value | Unit | Year |
|---|---|---|---|
| Houses 1 room | 291.045 | Number | 2019 |
| Houses 2 rooms | 589.006 | Number | 2019 |
| Houses 3 rooms | 1.218.661 | Number | 2019 |
| Houses 4 rooms | 1.432.286 | Number | 2019 |
| Houses 5 rooms | 1.085.877 | Number | 2019 |
| Houses 6 rooms | 812.777 | Number | 2019 |
| Houses 7+ rooms | 1.000.640 | Number | 2019 |
| Houses 1-2 rooms | 880.051 | Number | 2019 |
| Houses 3-4 rooms | 2.650.947 | Number | 2019 |
| Houses 5+ rooms | 2.899.294 | Number | 2019 |
| 1-2 rooms | 14% | Percentage | 2019 |
| 3-4 rooms | 41% | Percentage | 2019 |
| 5+ rooms | 45% | Percentage | 2019 |
| Elections | Value | Unit | Year |
|---|---|---|---|
| Voters Bundestag | 9522371,00 | Number | 2017 |
| Voter turnout Bundestag | 78 | Number | 2017 |
| Votes valid Bundestag | 7.393.210 | Number | 2017 |
| Votes Bundestag CDU/CSU | 2.869.688 | Number | 2017 |
| Votes Bundestag SPD | 1.130.931 | Number | 2017 |
| Votes Bundestag GRÜNE | 722.116 | Number | 2017 |
| Votes Bundestag FDP | 751.248 | Number | 2017 |
| Votes Bundestag DIE LINKE | 450.803 | Number | 2017 |
| Votes Bundestag AfD | 916.300 | Number | 2017 |
| Votes Bundestag other parties | 552.124 | Number | 2017 |
| Votes Bundestag total | 7.393.210 | Number | 2017 |
| % Votes Bundestag CDU/CSU | 30% | Percentage | 2017 |
| % Votes Bundestag SPD | 12% | Percentage | 2017 |
| % Votes Bundestag GRÜNE | 8% | Percentage | 2017 |
| % Votes Bundestag FDP | 8% | Percentage | 2017 |
| % Votes Bundestag DIE LINKE | 5% | Percentage | 2017 |
| % Votes Bundestag AfD | 10% | Percentage | 2017 |
| % Votes Bundestag other parties | 6% | Percentage | 2017 |
| Employment | Value | Unit | Year |
|---|---|---|---|
| Employees | 5.598.815 | Number | 2019 |
| Employees male | 3.018.583 | Number | 2019 |
| Employees female | 2.580.232 | Number | 2019 |
| Employees foreigner | 826.953 | Number | 2019 |
| Employees male foreigner | 508.437 | Number | 2019 |
| Employees female foreigner | 318.516 | Number | 2019 |
| Unemployed | 214.017 | Number | 2018 |
| Unemployed foreigners | 63.090 | Number | 2018 |
| Unemployed severely disabled | 20.690 | Number | 2018 |
| Unemployed 15-20 | 4.817 | Number | 2018 |
| Unemployed 15-25 | 21.027 | Number | 2018 |
| Unemployed 55-65 | 52.689 | Number | 2018 |
| Unemployed long-term | 48.714 | Number | 2018 |
| % Unemployed | 2% | Percentage | 2018 |
| % Unemployed foreigners | 0% | Percentage of the population | 2018 |
| % Unemployed severely disabled | 0% | Percentage of the population | 2018 |
| % Unemployed 15-20 | 0% | Percentage of the population | 2018 |
| % Unemployed 15-25 | 0% | Percentage of the population | 2018 |
| % Unemployed 55-65 | 0% | Percentage of the population | 2018 |
| % Unemployed long-term | 0% | Percentage of the population | 2018 |
| Income | Value | Unit | Year |
|---|---|---|---|
| Income receivers | 6.723.412 | Number | 2015 |
| Income total | €282.756.784 | Euro | 2015 |
| Income tax | €53.320.705 | Euro | 2015 |
| Population | Value | Unit | Year |
|---|---|---|---|
| Population | 13.076.721 | Number | 2019 |
| Men | 6.483.793 | Number | 2019 |
| Women | 6.592.928 | Number | 2019 |
| % Men | 50% | Percentage | 2019 |
| % Women | 50% | Percentage | 2019 |
| 0-18 | 2.145.460 | Number | 2019 |
| 18-30 | 1.911.934 | Number | 2019 |
| 30-45 | 2.512.751 | Number | 2019 |
| 45-60 | 3.015.090 | Number | 2019 |
| 18-60 | 7.439.775 | Number | 2019 |
| 60-75 | 2.100.804 | Number | 2019 |
| 60+ | 3.491.486 | Number | 2019 |
| Average age | 44 | Average number | 2019 |
| Average age male | 42 | Average number | 2019 |
| Average age female | 45 | Average number | 2019 |
| Births | 126.191 | Number | 2018 |
| Births male | 64.294 | Number | 2018 |
| Births female | 61.897 | Number | 2018 |
| 1K Births | 10 | Number per 1000 inhabitants | 2018 |
| Deaths | 133.902 | Number | 2018 |
| Deaths male | 65.158 | Number | 2018 |
| Deaths female | 68.744 | Number | 2018 |
| 1K Deaths | 10 | Number | 2018 |
| 0-3 | 383.864 | Number | 2019 |
| Girls 0-3 | 187.521 | Number | 2019 |
| Boys 0-3 | 196.343 | Number | 2019 |
| 3-6 | 361.820 | Number | 2019 |
| Girls 3-6 | 176.519 | Number | 2019 |
| Boys 3-6 | 185.301 | Number | 2019 |
| 6-10 | 455.220 | Number | 2019 |
| 10-15 | 578.203 | Number | 2019 |
| 15-18 | 366.353 | Number | 2019 |
| 18-20 | 272.977 | Number | 2019 |
| 20-25 | 770.917 | Number | 2019 |
| 25-30 | 868.040 | Number | 2019 |
| 30-35 | 868.872 | Number | 2019 |
| 35-40 | 849.054 | Number | 2019 |
| 40-45 | 794.825 | Number | 2019 |
| 45-50 | 906.380 | Number | 2019 |
| 50-55 | 1.089.004 | Number | 2019 |
| 55-60 | 1.019.706 | Number | 2019 |
| 60-65 | 828.922 | Number | 2019 |
| 65-75 | 1.271.882 | Number | 2019 |
| Women 65-70 | 668.368 | Number | 2019 |
| Men 65-70 | 603.514 | Number | 2019 |
| 75+ | 1.390.682 | Number | 2019 |
| Women 75+ | 818.866 | Number | 2019 |
| Men 75+ | 571.816 | Number | 2019 |
| % 0-10 | 9% | Percentage | 2019 |
| % 10-18 | 7% | Percentage | 2019 |
| % 18-30 | 15% | Percentage | 2019 |
| % 30-45 | 19% | Percentage | 2019 |
| % 45-60 | 23% | Percentage | 2019 |
| % 60+ | 27% | Percentage | 2019 |
| Real estate | Value | Unit | Year |
|---|---|---|---|
| Property tax A revenue | no data | Euro | no data |
| Property tax B revenue | no data | Euro | no data |
| Trade tax actual revenue | no data | Euro | no data |
| Property tax A basic amount | no data | Euro | no data |
| Property tax B basic amount | no data | Euro | no data |
| Trade tax basic amount | no data | Euro | no data |
| Property tax A rate | no data | Euro | no data |
| Property tax B rate | no data | Euro | no data |
| Trade tax rate | no data | Euro | no data |
| Real tax raising force | no data | Euro | no data |
| Trade tax levy | no data | Euro | no data |
| Trade tax net | no data | Euro | no data |
| Community share in income tax | no data | Euro | no data |
| Community share in sales tax | no data | Euro | no data |
| Tax revenue | no data | Euro | no data |
| Regional | Value | Unit | Year |
|---|---|---|---|
| Region code | 09 | Code | 2019 |
| Region code 8 digits | 09 | Code | 09 |
| Sorting code | 090000000000 | Code | 090000000000 |
| Sorting code 8 digits | 09000000 | Code | 09000000 |
| Region name | Bavaria | Name | 2019 |
| Regional level | 2 | Categorical type | 2019 |
| Region type | State | Categorical type | 2019 |
| Region type detail | free state | Categorical type | 2019 |
| Region name with type | free state Bavaria | Name | 2019 |
| Region name in German | Freistaat Bayern | Name | 2019 |
| Direct subregions | 96 | Number | 2019 |
| NUTS code | DE2 | Code | 2019 |
| Area | 70.549 | Area in km² | 2019 |
| Religion | Value | Unit | Year |
|---|---|---|---|
| Roman Catholic church | 6.676.806 | Number | 2011 |
| Protestant church | 2.517.530 | Number | 2011 |
| Other or none | 3.203.278 | Number | 2011 |
| % Roman Catholic church | 54% | Percentage | 2011 |
| % Protestant church | 20% | Percentage | 2011 |
| % Other or none | 26% | Percentage | 2011 |
| Roman Catholic church German | 6.414.672 | Number | 2011 |
| Protestant church German | 2.487.759 | Number | 2011 |
| Other or none German | 2.477.222 | Number | 2011 |
| % Roman Catholic church German | 56% | Percentage | 2011 |
| % Protestant church German | 22% | Percentage | 2011 |
| % Other or none German Foreign | 22% | Percentage | 2011 |
| Roman Catholic church Foreign | 262.134 | Number | 2011 |
| Protestant church Foreign | 29.771 | Number | 2011 |
| Other or none Foreign | 726.056 | Number | 2011 |
| % Roman Catholic church Foreign | 26% | Percentage | 2011 |
| % Protestant church Foreign | 3% | Percentage | 2011 |
| % Other or none Foreign | 71% | Percentage | 2011 |
Open data sources used
Data is used from multiple German open data providers. See this description of the sources with the definitions of all regional topics.
Sources & definitionsUnder development
Work is in progress to add more information to this page
This page will be further expanded with more topics in clear graphs. This will be done in several iterations in the coming weeks.