Population numbers per year
The number of inhabitants in the independent city district Mönchengladbach
One moment please, your device is loading the charts...
Population numbers in the independent city district Mönchengladbach for the years 2009 thru 2019.
The number of inhabitants is the number of persons as registered in the population register on January 1st.
Population at the map of Mönchengladbach
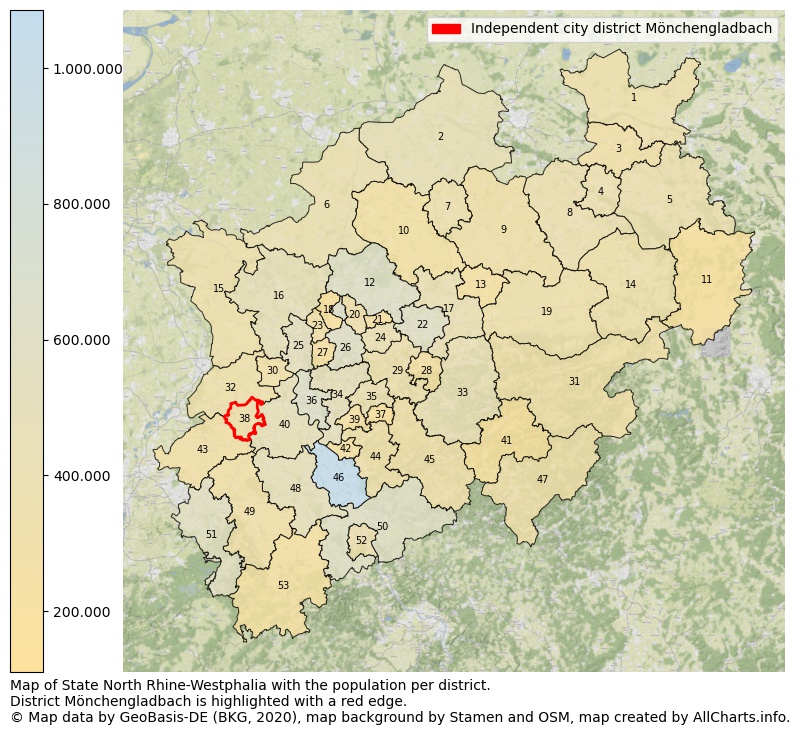
Map of State North Rhine-Westphalia with the population per district.District Mönchengladbach is highlighted with a red edge. The numbers at the map represent the following districts: 1: district Minden-Lübbecke, 2: district Steinfurt, 3: district Herford, 4: independent city district Bielefeld, 5: district Lyppe ...Show more... Map of State North Rhine-Westphalia with the population per district.District Mönchengladbach is highlighted with a red edge. The numbers at the map represent the following districts: 1: district Minden-Lübbecke, 2: district Steinfurt, 3: district Herford, 4: independent city district Bielefeld, 5: district Lyppe, 6: district Borken, 7: independent city district Münster, 8: district Gütersloh, 9: district Warendorf, 10: district Coesfeld, 11: district Höxter, 12: district Recklinghausen, 13: independent city district Hamm, 14: district Paderborn, 15: district Cleves, 16: district Wesel, 17: district Unna, 18: independent city district Bottrop, 19: district Soest, 20: independent city district Gelsenkirchen, 21: independent city district Herne, 22: independent city district Dortmund, 23: independent city district Oberhausen, 24: independent city district Bochum, 25: independent city district Duisburg, 26: independent city district Essen, 27: independent city district Mülheim an der Ruhr, 28: independent city district Hagen, 29: district Ennepe-Ruhr-Kreis, 30: independent city district Krefeld, 31: district Hochsauerlandkreis, 32: district Viersen, 33: district Märkischer Kreis, 34: district Mettmann, 35: independent city district Wuppertal, 36: independent city district Düsseldorf, 37: independent city district Remscheid, 38: independent city district Mönchengladbach, 39: independent city district Solingen, 40: district Rhein-Kreis Neuss, 41: district Olpe, 42: independent city district Leverkusen, 43: district Heinsberg, 44: district Rheinisch-Bergischer Kreis, 45: district Oberbergischer Kreis, 46: independent city district Cologne, 47: district Siegen-Wittgenstein, 48: district Rhein-Erft-Kreis, 49: district Düren, 50: district Rhein-Sieg-Kreis, 51: district Städteregion Aachen, 52: independent city district Bonn, 53: district Euskirchen ...Show less...
Population per age group
The percentage of inhabitants per age group in the independent city district Mönchengladbach
One moment please, your device is loading the charts...
Independent city district Mönchengladbach, 2019, age groups.
Population, age groups: percentage of inhabitants per age category.
The number of rooms per house (dwelling)
The number of rooms of the houses in the independent city district Mönchengladbach
One moment please, your device is loading the charts...
Independent city district Mönchengladbach, 2019, number of rooms per house.
The percentage shows the relative share of houses per category based on the numer of rooms: 1 to 2 rooms, 3 to 4 rooms or 5 rooms or more. This is based on the total number of rooms as identified for all dwellings in the independent city district Mönchengladbach.
Data about more than 100 topics!
The table below shows data for more than 100 topics as most recently available for the independent city district Mönchengladbach. Select a category to display the related topics:
| Business | Value | Unit | Year |
|---|---|---|---|
| Businesses | 115 | Number | 2017 |
| Active persons | 14.144 | Number | 2017 |
| Gross wages | €681.786 | Euro | 2017 |
| Dwellings | Value | Unit | Year |
|---|---|---|---|
| Houses 1 room | 4.321 | Number | 2019 |
| Houses 2 rooms | 15.821 | Number | 2019 |
| Houses 3 rooms | 36.530 | Number | 2019 |
| Houses 4 rooms | 35.562 | Number | 2019 |
| Houses 5 rooms | 21.492 | Number | 2019 |
| Houses 6 rooms | 12.110 | Number | 2019 |
| Houses 7+ rooms | 11.676 | Number | 2019 |
| Houses 1-2 rooms | 20.142 | Number | 2019 |
| Houses 3-4 rooms | 72.092 | Number | 2019 |
| Houses 5+ rooms | 45.278 | Number | 2019 |
| 1-2 rooms | 15% | Percentage | 2019 |
| 3-4 rooms | 52% | Percentage | 2019 |
| 5+ rooms | 33% | Percentage | 2019 |
| Elections | Value | Unit | Year |
|---|---|---|---|
| Voters Bundestag | 190552,00 | Number | 2017 |
| Voter turnout Bundestag | 69 | Number | 2017 |
| Votes valid Bundestag | 130.836 | Number | 2017 |
| Votes Bundestag CDU/CSU | 46.786 | Number | 2017 |
| Votes Bundestag SPD | 30.547 | Number | 2017 |
| Votes Bundestag GRÜNE | 8.169 | Number | 2017 |
| Votes Bundestag FDP | 17.946 | Number | 2017 |
| Votes Bundestag DIE LINKE | 9.627 | Number | 2017 |
| Votes Bundestag AfD | 12.373 | Number | 2017 |
| Votes Bundestag other parties | 5.388 | Number | 2017 |
| Votes Bundestag total | 130.836 | Number | 2017 |
| % Votes Bundestag CDU/CSU | 25% | Percentage | 2017 |
| % Votes Bundestag SPD | 16% | Percentage | 2017 |
| % Votes Bundestag GRÜNE | 4% | Percentage | 2017 |
| % Votes Bundestag FDP | 9% | Percentage | 2017 |
| % Votes Bundestag DIE LINKE | 5% | Percentage | 2017 |
| % Votes Bundestag AfD | 6% | Percentage | 2017 |
| % Votes Bundestag other parties | 3% | Percentage | 2017 |
| Employment | Value | Unit | Year |
|---|---|---|---|
| Employees | 96.787 | Number | 2019 |
| Employees male | 53.174 | Number | 2019 |
| Employees female | 43.613 | Number | 2019 |
| Employees foreigner | 13.279 | Number | 2019 |
| Employees male foreigner | 8.605 | Number | 2019 |
| Employees female foreigner | 4.674 | Number | 2019 |
| Unemployed | 13.557 | Number | 2018 |
| Unemployed foreigners | 3.682 | Number | 2018 |
| Unemployed severely disabled | 1.030 | Number | 2018 |
| Unemployed 15-20 | 253 | Number | 2018 |
| Unemployed 15-25 | 1.277 | Number | 2018 |
| Unemployed 55-65 | 2.599 | Number | 2018 |
| Unemployed long-term | 5.709 | Number | 2018 |
| % Unemployed | 5% | Percentage | 2018 |
| % Unemployed foreigners | 1% | Percentage of the population | 2018 |
| % Unemployed severely disabled | 0% | Percentage of the population | 2018 |
| % Unemployed 15-20 | 0% | Percentage of the population | 2018 |
| % Unemployed 15-25 | 0% | Percentage of the population | 2018 |
| % Unemployed 55-65 | 1% | Percentage of the population | 2018 |
| % Unemployed long-term | 2% | Percentage of the population | 2018 |
| Income | Value | Unit | Year |
|---|---|---|---|
| Income receivers | 121.452 | Number | 2015 |
| Income total | €4.263.961 | Euro | 2015 |
| Income tax | €730.296 | Euro | 2015 |
| Population | Value | Unit | Year |
|---|---|---|---|
| Population | 261.454 | Number | 2019 |
| Men | 128.655 | Number | 2019 |
| Women | 132.799 | Number | 2019 |
| % Men | 49% | Percentage | 2019 |
| % Women | 51% | Percentage | 2019 |
| 0-18 | 43.366 | Number | 2019 |
| 18-30 | 38.515 | Number | 2019 |
| 30-45 | 47.407 | Number | 2019 |
| 45-60 | 59.964 | Number | 2019 |
| 18-60 | 145.886 | Number | 2019 |
| 60-75 | 43.940 | Number | 2019 |
| 60+ | 72.202 | Number | 2019 |
| Average age | 44 | Average number | 2019 |
| Average age male | 43 | Average number | 2019 |
| Average age female | 45 | Average number | 2019 |
| Births | 2.622 | Number | 2018 |
| Births male | 1.393 | Number | 2018 |
| Births female | 1.229 | Number | 2018 |
| 1K Births | 10 | Number per 1000 inhabitants | 2018 |
| Deaths | 3.136 | Number | 2018 |
| Deaths male | 1.524 | Number | 2018 |
| Deaths female | 1.612 | Number | 2018 |
| 1K Deaths | 12 | Number | 2018 |
| 0-3 | 7.765 | Number | 2019 |
| Girls 0-3 | 3.672 | Number | 2019 |
| Boys 0-3 | 4.093 | Number | 2019 |
| 3-6 | 7.149 | Number | 2019 |
| Girls 3-6 | 3.510 | Number | 2019 |
| Boys 3-6 | 3.639 | Number | 2019 |
| 6-10 | 9.115 | Number | 2019 |
| 10-15 | 11.829 | Number | 2019 |
| 15-18 | 7.508 | Number | 2019 |
| 18-20 | 5.407 | Number | 2019 |
| 20-25 | 15.389 | Number | 2019 |
| 25-30 | 17.719 | Number | 2019 |
| 30-35 | 17.095 | Number | 2019 |
| 35-40 | 15.611 | Number | 2019 |
| 40-45 | 14.701 | Number | 2019 |
| 45-50 | 17.282 | Number | 2019 |
| 50-55 | 21.714 | Number | 2019 |
| 55-60 | 20.968 | Number | 2019 |
| 60-65 | 17.679 | Number | 2019 |
| 65-75 | 26.261 | Number | 2019 |
| Women 65-70 | 13.838 | Number | 2019 |
| Men 65-70 | 12.423 | Number | 2019 |
| 75+ | 28.262 | Number | 2019 |
| Women 75+ | 16.959 | Number | 2019 |
| Men 75+ | 11.303 | Number | 2019 |
| % 0-10 | 9% | Percentage | 2019 |
| % 10-18 | 7% | Percentage | 2019 |
| % 18-30 | 15% | Percentage | 2019 |
| % 30-45 | 18% | Percentage | 2019 |
| % 45-60 | 23% | Percentage | 2019 |
| % 60+ | 28% | Percentage | 2019 |
| Real estate | Value | Unit | Year |
|---|---|---|---|
| Property tax A revenue | €205.606 | Euro | 2018 |
| Property tax B revenue | €58.371.906 | Euro | 2018 |
| Trade tax actual revenue | €190.651.308 | Euro | 2018 |
| Property tax A basic amount | €85.669 | Euro | 2018 |
| Property tax B basic amount | €9.414.824 | Euro | 2018 |
| Trade tax basic amount | €38.908.430 | Euro | 2018 |
| Property tax A rate | €240 | Euro | 2018 |
| Property tax B rate | €620 | Euro | 2018 |
| Trade tax rate | €490 | Euro | 2018 |
| Real tax raising force | €201.194.136 | Euro | 2018 |
| Trade tax levy | €28.293.123 | Euro | 2018 |
| Trade tax net | €162.358.185 | Euro | 2018 |
| Community share in income tax | €110.859.856 | Euro | 2018 |
| Community share in sales tax | €25.700.782 | Euro | 2018 |
| Tax revenue | €309.461.651 | Euro | 2018 |
| Regional | Value | Unit | Year |
|---|---|---|---|
| Region code | 05116 | Code | 2019 |
| Region code 8 digits | 05116 | Code | 05116 |
| Sorting code | 051160000000 | Code | 051160000000 |
| Sorting code 8 digits | 05116000 | Code | 05116000 |
| Region name | Mönchengladbach | Name | 2019 |
| Regional level | 4 | Categorical type | 2019 |
| Region type | District | Categorical type | 2019 |
| Region type detail | independent city district | Categorical type | 2019 |
| Region name with type | independent city district Mönchengladbach | Name | 2019 |
| Region name in German | Kreisfreie Stadt Mönchengladbach | Name | 2019 |
| Direct subregions | 1 | Number | 2019 |
| NUTS code | DEA15 | Code | 2019 |
| Area | 170 | Area in km² | 2019 |
| Religion | Value | Unit | Year |
|---|---|---|---|
| Roman Catholic church | 132.399 | Number | 2011 |
| Protestant church | 46.683 | Number | 2011 |
| Other or none | 76.106 | Number | 2011 |
| % Roman Catholic church | 52% | Percentage | 2011 |
| % Protestant church | 18% | Percentage | 2011 |
| % Other or none | 30% | Percentage | 2011 |
| Roman Catholic church German | 126.079 | Number | 2011 |
| Protestant church German | 46.059 | Number | 2011 |
| Other or none German | 57.974 | Number | 2011 |
| % Roman Catholic church German | 55% | Percentage | 2011 |
| % Protestant church German | 20% | Percentage | 2011 |
| % Other or none German Foreign | 25% | Percentage | 2011 |
| Roman Catholic church Foreign | 6.320 | Number | 2011 |
| Protestant church Foreign | 624 | Number | 2011 |
| Other or none Foreign | 18.132 | Number | 2011 |
| % Roman Catholic church Foreign | 25% | Percentage | 2011 |
| % Protestant church Foreign | 2% | Percentage | 2011 |
| % Other or none Foreign | 72% | Percentage | 2011 |
Open data sources used
Data is used from multiple German open data providers. See this description of the sources with the definitions of all regional topics.
Sources & definitionsUnder development
Work is in progress to add more information to this page
This page will be further expanded with more topics in clear graphs. This will be done in several iterations in the coming weeks.