Population numbers per year
The number of inhabitants in the independent city district Osnabrück
One moment please, your device is loading the charts...
Population numbers in the independent city district Osnabrück for the years 2009 thru 2019.
The number of inhabitants is the number of persons as registered in the population register on January 1st.
Population at the map of Osnabrück
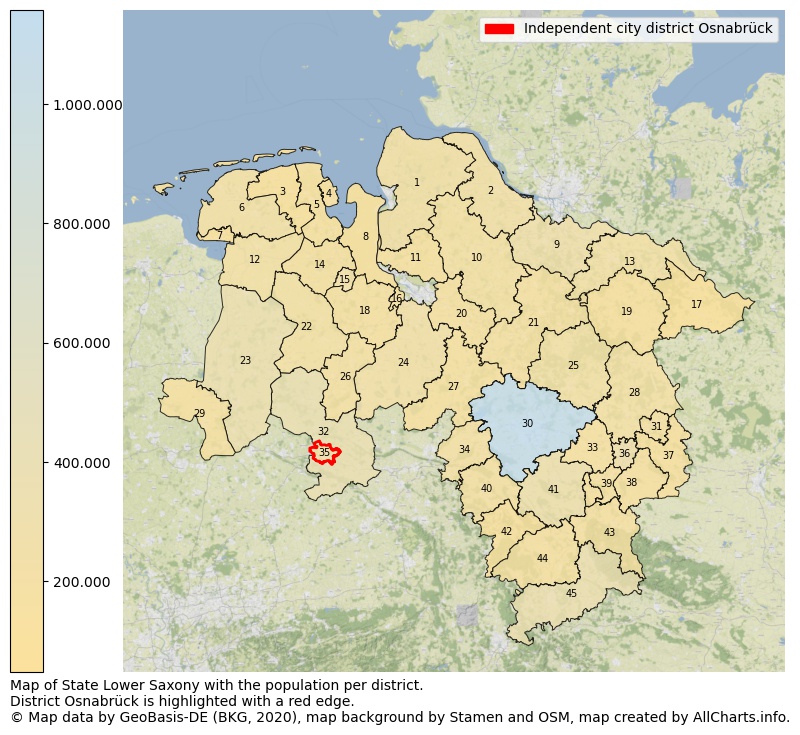
Map of State Lower Saxony with the population per district.District Osnabrück is highlighted with a red edge. The numbers at the map represent the following districts: 1: rural district Cuxhaven, 2: rural district Stade, 3: rural district Wittmund, 4: independent city district Wilhelmshaven, 5: rural district Frisia ...Show more... Map of State Lower Saxony with the population per district.District Osnabrück is highlighted with a red edge. The numbers at the map represent the following districts: 1: rural district Cuxhaven, 2: rural district Stade, 3: rural district Wittmund, 4: independent city district Wilhelmshaven, 5: rural district Frisia, 6: rural district Aurich, 7: independent city district Emden, 8: rural district Wesermarsch, 9: rural district Harburg, 10: rural district Rotenburg (Wümme), 11: rural district Osterholz, 12: rural district Leer, 13: rural district Lüneburg, 14: rural district Ammerland, 15: independent city district Oldenburg (Oldb), 16: independent city district Delmenhorst, 17: rural district Lüchow-Dannenberg, 18: rural district Oldenburg, 19: rural district Uelzen, 20: rural district Verden, 21: rural district Heidekreis, 22: rural district Cloppenburg, 23: rural district Emsland, 24: rural district Diepholz, 25: rural district Celle, 26: rural district Vechta, 27: rural district Nienburg (Weser), 28: rural district Gifhorn, 29: rural district Grafschaft Bentheim, 30: rural district Region Hannover, 31: independent city district Wolfsburg, 32: rural district Osnabrück, 33: rural district Peine, 34: rural district Schaumburg, 35: independent city district Osnabrück, 36: independent city district Braunschweig, 37: rural district Helmstedt, 38: rural district Wolfenbüttel, 39: independent city district Salzgitter, 40: rural district Hameln-Pyrmont, 41: rural district Hildesheim, 42: rural district Holzminden, 43: rural district Goslar, 44: rural district Northeim, 45: rural district Göttingen ...Show less...
The number of rooms per house (dwelling)
The number of rooms of the houses in the independent city district Osnabrück
One moment please, your device is loading the charts...
Independent city district Osnabrück, 2019, number of rooms per house.
The percentage shows the relative share of houses per category based on the numer of rooms: 1 to 2 rooms, 3 to 4 rooms or 5 rooms or more. This is based on the total number of rooms as identified for all dwellings in the independent city district Osnabrück.
Data about more than 100 topics!
The table below shows data for more than 100 topics as most recently available for the independent city district Osnabrück. Select a category to display the related topics:
| Business | Value | Unit | Year |
|---|---|---|---|
| Businesses | 80 | Number | 2017 |
| Active persons | 10.912 | Number | 2017 |
| Gross wages | €542.209 | Euro | 2017 |
| Dwellings | Value | Unit | Year |
|---|---|---|---|
| Houses 1 room | 4.159 | Number | 2019 |
| Houses 2 rooms | 7.852 | Number | 2019 |
| Houses 3 rooms | 20.263 | Number | 2019 |
| Houses 4 rooms | 25.419 | Number | 2019 |
| Houses 5 rooms | 14.683 | Number | 2019 |
| Houses 6 rooms | 7.730 | Number | 2019 |
| Houses 7+ rooms | 7.671 | Number | 2019 |
| Houses 1-2 rooms | 12.011 | Number | 2019 |
| Houses 3-4 rooms | 45.682 | Number | 2019 |
| Houses 5+ rooms | 30.084 | Number | 2019 |
| 1-2 rooms | 14% | Percentage | 2019 |
| 3-4 rooms | 52% | Percentage | 2019 |
| 5+ rooms | 34% | Percentage | 2019 |
| Elections | Value | Unit | Year |
|---|---|---|---|
| Voters Bundestag | 123090,00 | Number | 2017 |
| Voter turnout Bundestag | 76 | Number | 2017 |
| Votes valid Bundestag | 92.810 | Number | 2017 |
| Votes Bundestag CDU/CSU | 29.701 | Number | 2017 |
| Votes Bundestag SPD | 22.230 | Number | 2017 |
| Votes Bundestag GRÜNE | 13.094 | Number | 2017 |
| Votes Bundestag FDP | 9.243 | Number | 2017 |
| Votes Bundestag DIE LINKE | 9.232 | Number | 2017 |
| Votes Bundestag AfD | 5.769 | Number | 2017 |
| Votes Bundestag other parties | 3.541 | Number | 2017 |
| Votes Bundestag total | 92.810 | Number | 2017 |
| % Votes Bundestag CDU/CSU | 24% | Percentage | 2017 |
| % Votes Bundestag SPD | 18% | Percentage | 2017 |
| % Votes Bundestag GRÜNE | 11% | Percentage | 2017 |
| % Votes Bundestag FDP | 8% | Percentage | 2017 |
| % Votes Bundestag DIE LINKE | 8% | Percentage | 2017 |
| % Votes Bundestag AfD | 5% | Percentage | 2017 |
| % Votes Bundestag other parties | 3% | Percentage | 2017 |
| Employment | Value | Unit | Year |
|---|---|---|---|
| Employees | 66.112 | Number | 2019 |
| Employees male | 35.397 | Number | 2019 |
| Employees female | 30.715 | Number | 2019 |
| Employees foreigner | 7.697 | Number | 2019 |
| Employees male foreigner | 4.939 | Number | 2019 |
| Employees female foreigner | 2.758 | Number | 2019 |
| Unemployed | 6.576 | Number | 2018 |
| Unemployed foreigners | 2.081 | Number | 2018 |
| Unemployed severely disabled | 344 | Number | 2018 |
| Unemployed 15-20 | 114 | Number | 2018 |
| Unemployed 15-25 | 659 | Number | 2018 |
| Unemployed 55-65 | 1.099 | Number | 2018 |
| Unemployed long-term | 2.591 | Number | 2018 |
| % Unemployed | 4% | Percentage | 2018 |
| % Unemployed foreigners | 1% | Percentage of the population | 2018 |
| % Unemployed severely disabled | 0% | Percentage of the population | 2018 |
| % Unemployed 15-20 | 0% | Percentage of the population | 2018 |
| % Unemployed 15-25 | 0% | Percentage of the population | 2018 |
| % Unemployed 55-65 | 1% | Percentage of the population | 2018 |
| % Unemployed long-term | 2% | Percentage of the population | 2018 |
| Income | Value | Unit | Year |
|---|---|---|---|
| Income receivers | 82.758 | Number | 2015 |
| Income total | €3.032.875 | Euro | 2015 |
| Income tax | €557.183 | Euro | 2015 |
| Population | Value | Unit | Year |
|---|---|---|---|
| Population | 164.748 | Number | 2019 |
| Men | 79.756 | Number | 2019 |
| Women | 84.992 | Number | 2019 |
| % Men | 48% | Percentage | 2019 |
| % Women | 52% | Percentage | 2019 |
| 0-18 | 24.739 | Number | 2019 |
| 18-30 | 35.460 | Number | 2019 |
| 30-45 | 31.388 | Number | 2019 |
| 45-60 | 33.326 | Number | 2019 |
| 18-60 | 100.174 | Number | 2019 |
| 60-75 | 23.028 | Number | 2019 |
| 60+ | 39.835 | Number | 2019 |
| Average age | 42 | Average number | 2019 |
| Average age male | 41 | Average number | 2019 |
| Average age female | 43 | Average number | 2019 |
| Births | 1.674 | Number | 2018 |
| Births male | 833 | Number | 2018 |
| Births female | 841 | Number | 2018 |
| 1K Births | 10 | Number per 1000 inhabitants | 2018 |
| Deaths | 1.597 | Number | 2018 |
| Deaths male | 737 | Number | 2018 |
| Deaths female | 860 | Number | 2018 |
| 1K Deaths | 10 | Number | 2018 |
| 0-3 | 4.641 | Number | 2019 |
| Girls 0-3 | 2.265 | Number | 2019 |
| Boys 0-3 | 2.376 | Number | 2019 |
| 3-6 | 4.136 | Number | 2019 |
| Girls 3-6 | 2.040 | Number | 2019 |
| Boys 3-6 | 2.096 | Number | 2019 |
| 6-10 | 5.285 | Number | 2019 |
| 10-15 | 6.655 | Number | 2019 |
| 15-18 | 4.022 | Number | 2019 |
| 18-20 | 3.920 | Number | 2019 |
| 20-25 | 15.922 | Number | 2019 |
| 25-30 | 15.618 | Number | 2019 |
| 30-35 | 12.105 | Number | 2019 |
| 35-40 | 10.262 | Number | 2019 |
| 40-45 | 9.021 | Number | 2019 |
| 45-50 | 10.540 | Number | 2019 |
| 50-55 | 11.958 | Number | 2019 |
| 55-60 | 10.828 | Number | 2019 |
| 60-65 | 9.209 | Number | 2019 |
| 65-75 | 13.819 | Number | 2019 |
| Women 65-70 | 7.440 | Number | 2019 |
| Men 65-70 | 6.379 | Number | 2019 |
| 75+ | 16.807 | Number | 2019 |
| Women 75+ | 10.336 | Number | 2019 |
| Men 75+ | 6.471 | Number | 2019 |
| % 0-10 | 9% | Percentage | 2019 |
| % 10-18 | 6% | Percentage | 2019 |
| % 18-30 | 22% | Percentage | 2019 |
| % 30-45 | 19% | Percentage | 2019 |
| % 45-60 | 20% | Percentage | 2019 |
| % 60+ | 24% | Percentage | 2019 |
| Real estate | Value | Unit | Year |
|---|---|---|---|
| Property tax A revenue | €101.263 | Euro | 2018 |
| Property tax B revenue | €32.144.855 | Euro | 2018 |
| Trade tax actual revenue | €99.466.677 | Euro | 2018 |
| Property tax A basic amount | €33.754 | Euro | 2018 |
| Property tax B basic amount | €6.988.012 | Euro | 2018 |
| Trade tax basic amount | €22.606.063 | Euro | 2018 |
| Property tax A rate | €300 | Euro | 2018 |
| Property tax B rate | €460 | Euro | 2018 |
| Trade tax rate | €440 | Euro | 2018 |
| Real tax raising force | €124.010.412 | Euro | 2018 |
| Trade tax levy | €15.439.941 | Euro | 2018 |
| Trade tax net | €84.026.736 | Euro | 2018 |
| Community share in income tax | €70.115.993 | Euro | 2018 |
| Community share in sales tax | €20.848.705 | Euro | 2018 |
| Tax revenue | €199.535.169 | Euro | 2018 |
| Regional | Value | Unit | Year |
|---|---|---|---|
| Region code | 03404 | Code | 2019 |
| Region code 8 digits | 03404 | Code | 03404 |
| Sorting code | 034040000000 | Code | 034040000000 |
| Sorting code 8 digits | 03404000 | Code | 03404000 |
| Region name | Osnabrück | Name | 2019 |
| Regional level | 4 | Categorical type | 2019 |
| Region type | District | Categorical type | 2019 |
| Region type detail | independent city district | Categorical type | 2019 |
| Region name with type | independent city district Osnabrück | Name | 2019 |
| Region name in German | Kreisfreie Stadt Osnabrück | Name | 2019 |
| Direct subregions | 1 | Number | 2019 |
| NUTS code | DE944 | Code | 2019 |
| Area | 120 | Area in km² | 2019 |
| Religion | Value | Unit | Year |
|---|---|---|---|
| Roman Catholic church | 53.280 | Number | 2011 |
| Protestant church | 51.263 | Number | 2011 |
| Other or none | 49.156 | Number | 2011 |
| % Roman Catholic church | 35% | Percentage | 2011 |
| % Protestant church | 33% | Percentage | 2011 |
| % Other or none | 32% | Percentage | 2011 |
| Roman Catholic church German | 50.405 | Number | 2011 |
| Protestant church German | 50.867 | Number | 2011 |
| Other or none German | 39.127 | Number | 2011 |
| % Roman Catholic church German | 36% | Percentage | 2011 |
| % Protestant church German | 36% | Percentage | 2011 |
| % Other or none German Foreign | 28% | Percentage | 2011 |
| Roman Catholic church Foreign | 2.875 | Number | 2011 |
| Protestant church Foreign | 396 | Number | 2011 |
| Other or none Foreign | 10.029 | Number | 2011 |
| % Roman Catholic church Foreign | 22% | Percentage | 2011 |
| % Protestant church Foreign | 3% | Percentage | 2011 |
| % Other or none Foreign | 75% | Percentage | 2011 |
Open data sources used
Data is used from multiple German open data providers. See this description of the sources with the definitions of all regional topics.
Sources & definitionsUnder development
Work is in progress to add more information to this page
This page will be further expanded with more topics in clear graphs. This will be done in several iterations in the coming weeks.