One moment please, your device is loading the charts...
Population numbers in the municipality Biendorf for the years 2012 thru 2019.
The number of inhabitants is the number of persons as registered in the population register on January 1st.
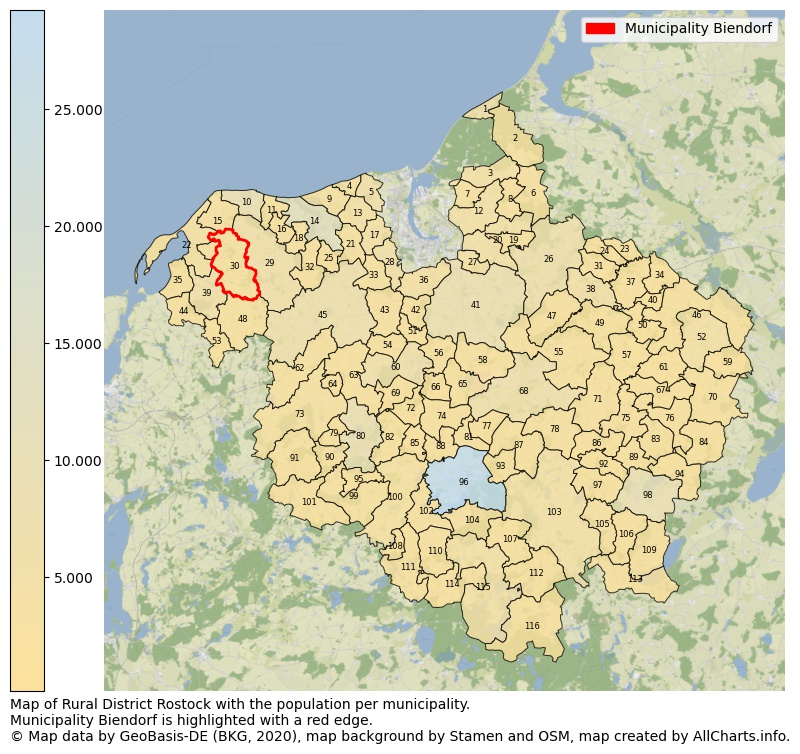
Map of Rural district Rostock with the population per municipality.Municipality Biendorf is highlighted with a red edge. The numbers at the map represent the following municipalities: 1: municipality Graal-Müritz, 2: municipality Gelbensande, 3: municipality Rövershagen, 4: municipality Nienhagen, 5: municipality Elmenhorst/Lichtenhagen ...Show more... Map of Rural district Rostock with the population per municipality.Municipality Biendorf is highlighted with a red edge. The numbers at the map represent the following municipalities: 1: municipality Graal-Müritz, 2: municipality Gelbensande, 3: municipality Rövershagen, 4: municipality Nienhagen, 5: municipality Elmenhorst/Lichtenhagen, 6: municipality Blankenhagen, 7: municipality Mönchhagen, 8: municipality Poppendorf, 9: municipality Börgerende-Rethwisch, 10: municipality city Kühlungsborn, 11: municipality Wittenbeck, 12: municipality Bentwisch, 13: municipality Admannshagen-Bargeshagen, 14: municipality city Bad Doberan, 15: municipality Bastorf, 16: municipality Steffenshagen, 17: municipality Lambrechtshagen, 18: municipality Reddelich, 19: municipality Thulendorf, 20: municipality Broderstorf, 21: municipality Bartenshagen-Parkentin, 22: municipality city Rerik, 23: municipality Stubbendorf, 24: municipality Gnewitz, 25: municipality Hohenfelde, 26: municipality Sanitz, 27: municipality Roggentin, 28: municipality Kritzmow, 29: municipality city Kröpelin, 30: municipality Biendorf, 31: municipality Zarnewanz, 32: municipality Retschow, 33: municipality Stäbelow, 34: municipality Grammow, 35: municipality Am Salzhaff, 36: municipality Papendorf, 37: municipality Thelkow, 38: municipality city Tessin, 39: municipality city Neubukow, 40: municipality Nustrow, 41: municipality Dummerstorf, 42: municipality Pölchow, 43: municipality Ziesendorf, 44: municipality Alt Bukow, 45: municipality Satow, 46: municipality Behren-Lübchin, 47: municipality Cammin, 48: municipality Carinerland, 49: municipality Selpin, 50: municipality Lühburg, 51: municipality Benitz, 52: municipality city Gnoien, 53: municipality Kirch Mulsow, 54: municipality Bröbberow, 55: municipality Wardow, 56: municipality Wiendorf, 57: municipality Walkendorf, 58: municipality Dolgen am See, 59: municipality Finkenthal, 60: municipality city Schwaan, 61: municipality Boddin, 62: municipality Jürgenshagen, 63: municipality Klein Belitz, 64: municipality Penzin, 65: municipality Hohen Sprenz, 66: municipality Rukieten, 67: municipality Schwasdorf, 68: municipality city Laage, 69: municipality Vorbeck, 70: municipality Altkalen, 71: municipality Prebberede, 72: municipality Kassow, 73: municipality Bernitt, 74: municipality Mistorf, 75: municipality Groß Wüstenfelde, 76: municipality Jördenstorf, 77: municipality Kuhs, 78: municipality Diekhof, 79: municipality Steinhagen, 80: municipality city Bützow, 81: municipality Sarmstorf, 82: municipality Zepelin, 83: municipality Sukow-Levitzow, 84: municipality Lelkendorf, 85: municipality Groß Schwiesow, 86: municipality Warnkenhagen, 87: municipality Plaaz, 88: municipality Lüssow, 89: municipality Thürkow, 90: municipality Rühn, 91: municipality Baumgarten, 92: municipality Dalkendorf, 93: municipality Glasewitz, 94: municipality Alt Sührkow, 95: municipality Dreetz, 96: municipality city Güstrow, 97: municipality Groß Roge, 98: municipality city Teterow, 99: municipality Tarnow, 100: municipality Gülzow-Prüzen, 101: municipality Warnow, 102: municipality Gutow, 103: municipality Lalendorf, 104: municipality Mühl Rosin, 105: municipality Groß Wokern, 106: municipality Hohen Demzin, 107: municipality Hoppenrade, 108: municipality Klein Upahl, 109: municipality Schorssow, 110: municipality Zehna, 111: municipality Lohmen, 112: municipality Kuchelmiß, 113: municipality Dahmen, 114: municipality Reimershagen, 115: municipality city Krakow am See, 116: municipality Dobbin-Linstow ...Show less...
One moment please, your device is loading the charts...
Municipality Biendorf, 2019, number of rooms per house.
The percentage shows the relative share of houses per category based on the numer of rooms: 1 to 2 rooms, 3 to 4 rooms or 5 rooms or more. This is based on the total number of rooms as identified for all dwellings in the municipality Biendorf.
The table below shows data for more than 100 topics as most recently available for the municipality Biendorf. Select a category to display the related topics:
| Business | Value | Unit | Year |
|---|---|---|---|
| Businesses | 1 | Number | 2017 |
| Active persons | 0 | Number | 2017 |
| Gross wages | €0 | Euro | 2017 |
| Dwellings | Value | Unit | Year |
|---|---|---|---|
| Houses 1 room | 2 | Number | 2019 |
| Houses 2 rooms | 29 | Number | 2019 |
| Houses 3 rooms | 102 | Number | 2019 |
| Houses 4 rooms | 157 | Number | 2019 |
| Houses 5 rooms | 154 | Number | 2019 |
| Houses 6 rooms | 76 | Number | 2019 |
| Houses 7+ rooms | 65 | Number | 2019 |
| Houses 1-2 rooms | 31 | Number | 2019 |
| Houses 3-4 rooms | 259 | Number | 2019 |
| Houses 5+ rooms | 295 | Number | 2019 |
| 1-2 rooms | 5% | Percentage | 2019 |
| 3-4 rooms | 44% | Percentage | 2019 |
| 5+ rooms | 50% | Percentage | 2019 |
| Elections | Value | Unit | Year |
|---|---|---|---|
| Voters Bundestag | 985,00 | Number | 2017 |
| Voter turnout Bundestag | 61 | Number | 2017 |
| Votes valid Bundestag | 589 | Number | 2017 |
| Votes Bundestag CDU/CSU | 179 | Number | 2017 |
| Votes Bundestag SPD | 76 | Number | 2017 |
| Votes Bundestag GRÜNE | 18 | Number | 2017 |
| Votes Bundestag FDP | 31 | Number | 2017 |
| Votes Bundestag DIE LINKE | 124 | Number | 2017 |
| Votes Bundestag AfD | 131 | Number | 2017 |
| Votes Bundestag other parties | 30 | Number | 2017 |
| Votes Bundestag total | 589 | Number | 2017 |
| % Votes Bundestag CDU/CSU | 18% | Percentage | 2017 |
| % Votes Bundestag SPD | 8% | Percentage | 2017 |
| % Votes Bundestag GRÜNE | 2% | Percentage | 2017 |
| % Votes Bundestag FDP | 3% | Percentage | 2017 |
| % Votes Bundestag DIE LINKE | 13% | Percentage | 2017 |
| % Votes Bundestag AfD | 13% | Percentage | 2017 |
| % Votes Bundestag other parties | 3% | Percentage | 2017 |
| Employment | Value | Unit | Year |
|---|---|---|---|
| Employees | 531 | Number | 2019 |
| Employees male | 263 | Number | 2019 |
| Employees female | 268 | Number | 2019 |
| Employees foreigner | 4 | Number | 2019 |
| Employees male foreigner | 4 | Number | 2019 |
| Employees female foreigner | 0 | Number | 2019 |
| Unemployed | 29 | Number | 2018 |
| Unemployed foreigners | 2 | Number | 2018 |
| Unemployed severely disabled | 0 | Number | 2018 |
| Unemployed 15-20 | 1 | Number | 2018 |
| Unemployed 15-25 | 3 | Number | 2018 |
| Unemployed 55-65 | 10 | Number | 2018 |
| Unemployed long-term | 7 | Number | 2018 |
| % Unemployed | 2% | Percentage | 2018 |
| % Unemployed foreigners | 0% | Percentage of the population | 2018 |
| % Unemployed severely disabled | 0% | Percentage of the population | 2018 |
| % Unemployed 15-20 | 0% | Percentage of the population | 2018 |
| % Unemployed 15-25 | 0% | Percentage of the population | 2018 |
| % Unemployed 55-65 | 1% | Percentage of the population | 2018 |
| % Unemployed long-term | 1% | Percentage of the population | 2018 |
| Income | Value | Unit | Year |
|---|---|---|---|
| Income receivers | 525 | Number | 2015 |
| Income total | €14.111 | Euro | 2015 |
| Income tax | €1.699 | Euro | 2015 |
| Population | Value | Unit | Year |
|---|---|---|---|
| Population | 1.196 | Number | 2019 |
| Men | 595 | Number | 2019 |
| Women | 601 | Number | 2019 |
| % Men | 50% | Percentage | 2019 |
| % Women | 50% | Percentage | 2019 |
| 0-18 | 211 | Number | 2019 |
| 18-30 | 89 | Number | 2019 |
| 30-45 | 242 | Number | 2019 |
| 45-60 | 310 | Number | 2019 |
| 18-60 | 641 | Number | 2019 |
| 60-75 | 251 | Number | 2019 |
| 60+ | 344 | Number | 2019 |
| Average age | 45 | Average number | 2019 |
| Average age male | 45 | Average number | 2019 |
| Average age female | 45 | Average number | 2019 |
| Births | 9 | Number | 2018 |
| Births male | 7 | Number | 2018 |
| Births female | 2 | Number | 2018 |
| 1K Births | 8 | Number per 1000 inhabitants | 2018 |
| Deaths | 8 | Number | 2018 |
| Deaths male | 3 | Number | 2018 |
| Deaths female | 5 | Number | 2018 |
| 1K Deaths | 7 | Number | 2018 |
| 0-3 | 29 | Number | 2019 |
| Girls 0-3 | 12 | Number | 2019 |
| Boys 0-3 | 17 | Number | 2019 |
| 3-6 | 34 | Number | 2019 |
| Girls 3-6 | 13 | Number | 2019 |
| Boys 3-6 | 21 | Number | 2019 |
| 6-10 | 49 | Number | 2019 |
| 10-15 | 68 | Number | 2019 |
| 15-18 | 31 | Number | 2019 |
| 18-20 | 12 | Number | 2019 |
| 20-25 | 28 | Number | 2019 |
| 25-30 | 49 | Number | 2019 |
| 30-35 | 78 | Number | 2019 |
| 35-40 | 97 | Number | 2019 |
| 40-45 | 67 | Number | 2019 |
| 45-50 | 81 | Number | 2019 |
| 50-55 | 102 | Number | 2019 |
| 55-60 | 127 | Number | 2019 |
| 60-65 | 126 | Number | 2019 |
| 65-75 | 125 | Number | 2019 |
| Women 65-70 | 63 | Number | 2019 |
| Men 65-70 | 62 | Number | 2019 |
| 75+ | 93 | Number | 2019 |
| Women 75+ | 53 | Number | 2019 |
| Men 75+ | 40 | Number | 2019 |
| % 0-10 | 9% | Percentage | 2019 |
| % 10-18 | 8% | Percentage | 2019 |
| % 18-30 | 7% | Percentage | 2019 |
| % 30-45 | 20% | Percentage | 2019 |
| % 45-60 | 26% | Percentage | 2019 |
| % 60+ | 29% | Percentage | 2019 |
| Real estate | Value | Unit | Year |
|---|---|---|---|
| Property tax A revenue | no data | Euro | no data |
| Property tax B revenue | no data | Euro | no data |
| Trade tax actual revenue | no data | Euro | no data |
| Property tax A basic amount | no data | Euro | no data |
| Property tax B basic amount | no data | Euro | no data |
| Trade tax basic amount | no data | Euro | no data |
| Property tax A rate | no data | Euro | no data |
| Property tax B rate | no data | Euro | no data |
| Trade tax rate | no data | Euro | no data |
| Real tax raising force | no data | Euro | no data |
| Trade tax levy | no data | Euro | no data |
| Trade tax net | no data | Euro | no data |
| Community share in income tax | no data | Euro | no data |
| Community share in sales tax | no data | Euro | no data |
| Tax revenue | no data | Euro | no data |
| Regional | Value | Unit | Year |
|---|---|---|---|
| Region code | 130725259014 | Code | 2019 |
| Region code 8 digits | 13072014 | Code | 13072014 |
| Sorting code | 130725259014 | Code | 130725259014 |
| Sorting code 8 digits | 13072014 | Code | 13072014 |
| Region name | Biendorf | Name | 2019 |
| Regional level | 6 | Categorical type | 2019 |
| Region type | Municipality | Categorical type | 2019 |
| Region type detail | municipality | Categorical type | 2019 |
| Region name with type | municipality Biendorf | Name | 2019 |
| Region name in German | Gemeinde Biendorf | Name | 2019 |
| Direct subregions | no data | Number | 2019 |
| NUTS code | DE80K | Code | 2019 |
| Area | 41 | Area in km² | 2019 |
| Religion | Value | Unit | Year |
|---|---|---|---|
| Roman Catholic church | no data | Number | no data |
| Protestant church | no data | Number | no data |
| Other or none | no data | Number | no data |
| % Roman Catholic church | no data | Percentage | no data |
| % Protestant church | no data | Percentage | no data |
| % Other or none | no data | Percentage | no data |
| Roman Catholic church German | no data | Number | no data |
| Protestant church German | no data | Number | no data |
| Other or none German | no data | Number | no data |
| % Roman Catholic church German | no data | Percentage | no data |
| % Protestant church German | no data | Percentage | no data |
| % Other or none German Foreign | no data | Percentage | no data |
| Roman Catholic church Foreign | no data | Number | no data |
| Protestant church Foreign | no data | Number | no data |
| Other or none Foreign | no data | Number | no data |
| % Roman Catholic church Foreign | no data | Percentage | no data |
| % Protestant church Foreign | no data | Percentage | no data |
| % Other or none Foreign | no data | Percentage | no data |
Data is used from multiple German open data providers. See this description of the sources with the definitions of all regional topics.
Sources & definitionsThis page will be further expanded with more topics in clear graphs. This will be done in several iterations in the coming weeks.
![]()
© Published:
 Contents and more information: