One moment please, your device is loading the charts...
Population numbers in the municipality Bösleben-Wüllersleben for the years 2009 thru 2019.
The number of inhabitants is the number of persons as registered in the population register on January 1st.
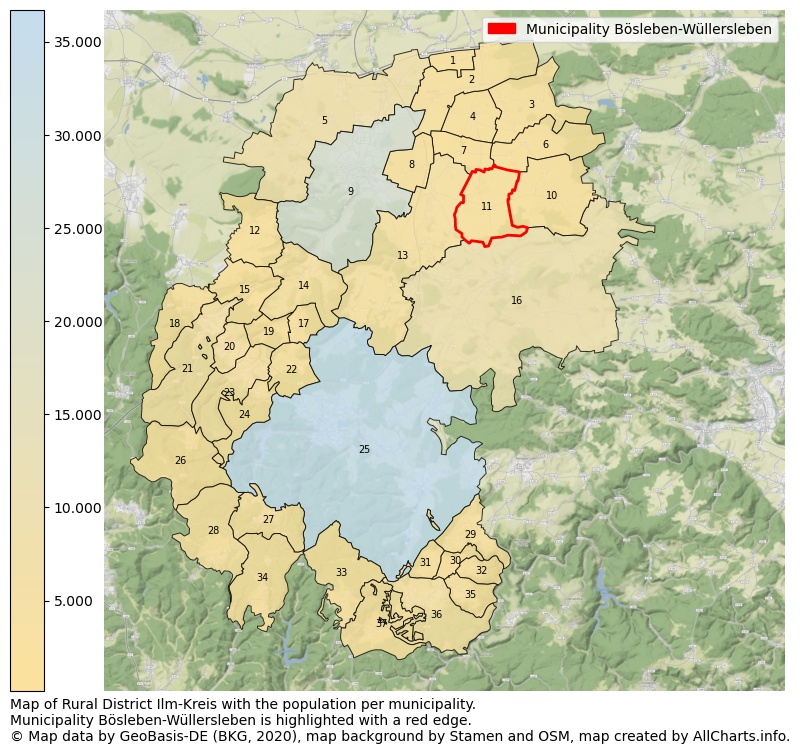
Map of Rural district Ilm-Kreis with the population per municipality.Municipality Bösleben-Wüllersleben is highlighted with a red edge. The numbers at the map represent the following municipalities: 1: municipality Rockhausen, 2: municipality Kirchheim, 3: municipality Elleben, 4: municipality Elxleben, 5: municipality Amt Wachsenburg ...Show more... Map of Rural district Ilm-Kreis with the population per municipality.Municipality Bösleben-Wüllersleben is highlighted with a red edge. The numbers at the map represent the following municipalities: 1: municipality Rockhausen, 2: municipality Kirchheim, 3: municipality Elleben, 4: municipality Elxleben, 5: municipality Amt Wachsenburg, 6: municipality Osthausen-Wülfershausen, 7: municipality Alkersleben, 8: municipality Dornheim, 9: municipality city Arnstadt, 10: municipality Witzleben, 11: municipality Bösleben-Wüllersleben, 12: municipality Gossel, 13: municipality Wipfratal, 14: municipality city Plaue, 15: municipality Liebenstein, 16: municipality city Stadtilm, 17: municipality Neusiß, 18: municipality Frankenhain, 19: municipality Angelroda, 20: municipality Geschwenda, 21: municipality Gräfenroda, 22: municipality Martinroda, 23: municipality Geraberg, 24: municipality Elgersburg, 25: municipality city Ilmenau, 26: municipality Gehlberg, 27: municipality Stützerbach, 28: municipality Schmiedefeld am Rennsteig, 29: municipality Herschdorf, 30: municipality Friedersdorf, 31: municipality Gillersdorf, 32: municipality Wildenspring, 33: municipality Neustadt am Rennsteig, 34: municipality Frauenwald, 35: municipality Böhlen, 36: municipality city Großbreitenbach, 37: municipality Altenfeld ...Show less...
One moment please, your device is loading the charts...
Municipality Bösleben-Wüllersleben, 2019, number of rooms per house.
The percentage shows the relative share of houses per category based on the numer of rooms: 1 to 2 rooms, 3 to 4 rooms or 5 rooms or more. This is based on the total number of rooms as identified for all dwellings in the municipality Bösleben-Wüllersleben.
The table below shows data for more than 100 topics as most recently available for the municipality Bösleben-Wüllersleben. Select a category to display the related topics:
| Business | Value | Unit | Year |
|---|---|---|---|
| Businesses | 1 | Number | 2017 |
| Active persons | 0 | Number | 2017 |
| Gross wages | €0 | Euro | 2017 |
| Dwellings | Value | Unit | Year |
|---|---|---|---|
| Houses 1 room | 0 | Number | 2019 |
| Houses 2 rooms | 4 | Number | 2019 |
| Houses 3 rooms | 28 | Number | 2019 |
| Houses 4 rooms | 64 | Number | 2019 |
| Houses 5 rooms | 74 | Number | 2019 |
| Houses 6 rooms | 56 | Number | 2019 |
| Houses 7+ rooms | 69 | Number | 2019 |
| Houses 1-2 rooms | 4 | Number | 2019 |
| Houses 3-4 rooms | 92 | Number | 2019 |
| Houses 5+ rooms | 199 | Number | 2019 |
| 1-2 rooms | 1% | Percentage | 2019 |
| 3-4 rooms | 31% | Percentage | 2019 |
| 5+ rooms | 67% | Percentage | 2019 |
| Elections | Value | Unit | Year |
|---|---|---|---|
| Voters Bundestag | 542,00 | Number | 2017 |
| Voter turnout Bundestag | 76 | Number | 2017 |
| Votes valid Bundestag | 406 | Number | 2017 |
| Votes Bundestag CDU/CSU | 138 | Number | 2017 |
| Votes Bundestag SPD | 71 | Number | 2017 |
| Votes Bundestag GRÜNE | 9 | Number | 2017 |
| Votes Bundestag FDP | 30 | Number | 2017 |
| Votes Bundestag DIE LINKE | 47 | Number | 2017 |
| Votes Bundestag AfD | 77 | Number | 2017 |
| Votes Bundestag other parties | 34 | Number | 2017 |
| Votes Bundestag total | 406 | Number | 2017 |
| % Votes Bundestag CDU/CSU | 25% | Percentage | 2017 |
| % Votes Bundestag SPD | 13% | Percentage | 2017 |
| % Votes Bundestag GRÜNE | 2% | Percentage | 2017 |
| % Votes Bundestag FDP | 6% | Percentage | 2017 |
| % Votes Bundestag DIE LINKE | 9% | Percentage | 2017 |
| % Votes Bundestag AfD | 14% | Percentage | 2017 |
| % Votes Bundestag other parties | 6% | Percentage | 2017 |
| Employment | Value | Unit | Year |
|---|---|---|---|
| Employees | 270 | Number | 2019 |
| Employees male | 141 | Number | 2019 |
| Employees female | 129 | Number | 2019 |
| Employees foreigner | 0 | Number | 2019 |
| Employees male foreigner | 0 | Number | 2019 |
| Employees female foreigner | 0 | Number | 2019 |
| Unemployed | 9 | Number | 2018 |
| Unemployed foreigners | 1 | Number | 2018 |
| Unemployed severely disabled | 1 | Number | 2018 |
| Unemployed 15-20 | 0 | Number | 2018 |
| Unemployed 15-25 | 1 | Number | 2018 |
| Unemployed 55-65 | 4 | Number | 2018 |
| Unemployed long-term | 1 | Number | 2018 |
| % Unemployed | 1% | Percentage | 2018 |
| % Unemployed foreigners | 0% | Percentage of the population | 2018 |
| % Unemployed severely disabled | 0% | Percentage of the population | 2018 |
| % Unemployed 15-20 | 0% | Percentage of the population | 2018 |
| % Unemployed 15-25 | 0% | Percentage of the population | 2018 |
| % Unemployed 55-65 | 1% | Percentage of the population | 2018 |
| % Unemployed long-term | 0% | Percentage of the population | 2018 |
| Income | Value | Unit | Year |
|---|---|---|---|
| Income receivers | 317 | Number | 2015 |
| Income total | €9.694 | Euro | 2015 |
| Income tax | €1.293 | Euro | 2015 |
| Population | Value | Unit | Year |
|---|---|---|---|
| Population | 639 | Number | 2019 |
| Men | 321 | Number | 2019 |
| Women | 318 | Number | 2019 |
| % Men | 50% | Percentage | 2019 |
| % Women | 50% | Percentage | 2019 |
| 0-18 | 107 | Number | 2019 |
| 18-30 | 50 | Number | 2019 |
| 30-45 | 128 | Number | 2019 |
| 45-60 | 159 | Number | 2019 |
| 18-60 | 337 | Number | 2019 |
| 60-75 | 130 | Number | 2019 |
| 60+ | 195 | Number | 2019 |
| Average age | 46 | Average number | 2019 |
| Average age male | 45 | Average number | 2019 |
| Average age female | 46 | Average number | 2019 |
| Births | 6 | Number | 2018 |
| Births male | 3 | Number | 2018 |
| Births female | 3 | Number | 2018 |
| 1K Births | 9 | Number per 1000 inhabitants | 2018 |
| Deaths | 5 | Number | 2018 |
| Deaths male | 5 | Number | 2018 |
| Deaths female | 0 | Number | 2018 |
| 1K Deaths | 8 | Number | 2018 |
| 0-3 | 20 | Number | 2019 |
| Girls 0-3 | 11 | Number | 2019 |
| Boys 0-3 | 9 | Number | 2019 |
| 3-6 | 25 | Number | 2019 |
| Girls 3-6 | 13 | Number | 2019 |
| Boys 3-6 | 12 | Number | 2019 |
| 6-10 | 21 | Number | 2019 |
| 10-15 | 27 | Number | 2019 |
| 15-18 | 14 | Number | 2019 |
| 18-20 | 8 | Number | 2019 |
| 20-25 | 15 | Number | 2019 |
| 25-30 | 27 | Number | 2019 |
| 30-35 | 38 | Number | 2019 |
| 35-40 | 48 | Number | 2019 |
| 40-45 | 42 | Number | 2019 |
| 45-50 | 46 | Number | 2019 |
| 50-55 | 59 | Number | 2019 |
| 55-60 | 54 | Number | 2019 |
| 60-65 | 55 | Number | 2019 |
| 65-75 | 75 | Number | 2019 |
| Women 65-70 | 33 | Number | 2019 |
| Men 65-70 | 42 | Number | 2019 |
| 75+ | 65 | Number | 2019 |
| Women 75+ | 40 | Number | 2019 |
| Men 75+ | 25 | Number | 2019 |
| % 0-10 | 10% | Percentage | 2019 |
| % 10-18 | 6% | Percentage | 2019 |
| % 18-30 | 8% | Percentage | 2019 |
| % 30-45 | 20% | Percentage | 2019 |
| % 45-60 | 25% | Percentage | 2019 |
| % 60+ | 31% | Percentage | 2019 |
| Real estate | Value | Unit | Year |
|---|---|---|---|
| Property tax A revenue | no data | Euro | no data |
| Property tax B revenue | no data | Euro | no data |
| Trade tax actual revenue | no data | Euro | no data |
| Property tax A basic amount | no data | Euro | no data |
| Property tax B basic amount | no data | Euro | no data |
| Trade tax basic amount | no data | Euro | no data |
| Property tax A rate | no data | Euro | no data |
| Property tax B rate | no data | Euro | no data |
| Trade tax rate | no data | Euro | no data |
| Real tax raising force | no data | Euro | no data |
| Trade tax levy | no data | Euro | no data |
| Trade tax net | no data | Euro | no data |
| Community share in income tax | no data | Euro | no data |
| Community share in sales tax | no data | Euro | no data |
| Tax revenue | no data | Euro | no data |
| Regional | Value | Unit | Year |
|---|---|---|---|
| Region code | 160705009006 | Code | 2019 |
| Region code 8 digits | 16070006 | Code | 16070006 |
| Sorting code | 160705009006 | Code | 160705009006 |
| Sorting code 8 digits | 16070006 | Code | 16070006 |
| Region name | Bösleben-Wüllersleben | Name | 2019 |
| Regional level | 6 | Categorical type | 2019 |
| Region type | Municipality | Categorical type | 2019 |
| Region type detail | municipality | Categorical type | 2019 |
| Region name with type | municipality Bösleben-Wüllersleben | Name | 2019 |
| Region name in German | Gemeinde Bösleben-Wüllersleben | Name | 2019 |
| Direct subregions | no data | Number | 2019 |
| NUTS code | DEG0F | Code | 2019 |
| Area | 16 | Area in km² | 2019 |
| Religion | Value | Unit | Year |
|---|---|---|---|
| Roman Catholic church | 30 | Number | 2011 |
| Protestant church | 227 | Number | 2011 |
| Other or none | 352 | Number | 2011 |
| % Roman Catholic church | 5% | Percentage | 2011 |
| % Protestant church | 37% | Percentage | 2011 |
| % Other or none | 58% | Percentage | 2011 |
| Roman Catholic church German | 30 | Number | 2011 |
| Protestant church German | 227 | Number | 2011 |
| Other or none German | 345 | Number | 2011 |
| % Roman Catholic church German | 5% | Percentage | 2011 |
| % Protestant church German | 38% | Percentage | 2011 |
| % Other or none German Foreign | 57% | Percentage | 2011 |
| Roman Catholic church Foreign | 0 | Number | 2011 |
| Protestant church Foreign | 0 | Number | 2011 |
| Other or none Foreign | 7 | Number | 2011 |
| % Roman Catholic church Foreign | 0% | Percentage | 2011 |
| % Protestant church Foreign | 0% | Percentage | 2011 |
| % Other or none Foreign | 100% | Percentage | 2011 |
Data is used from multiple German open data providers. See this description of the sources with the definitions of all regional topics.
Sources & definitionsThis page will be further expanded with more topics in clear graphs. This will be done in several iterations in the coming weeks.
![]()
© Published:
 Contents and more information: