One moment please, your device is loading the charts...
Population numbers in the municipality Byhleguhre-Byhlen for the years 2009 thru 2019.
The number of inhabitants is the number of persons as registered in the population register on January 1st.
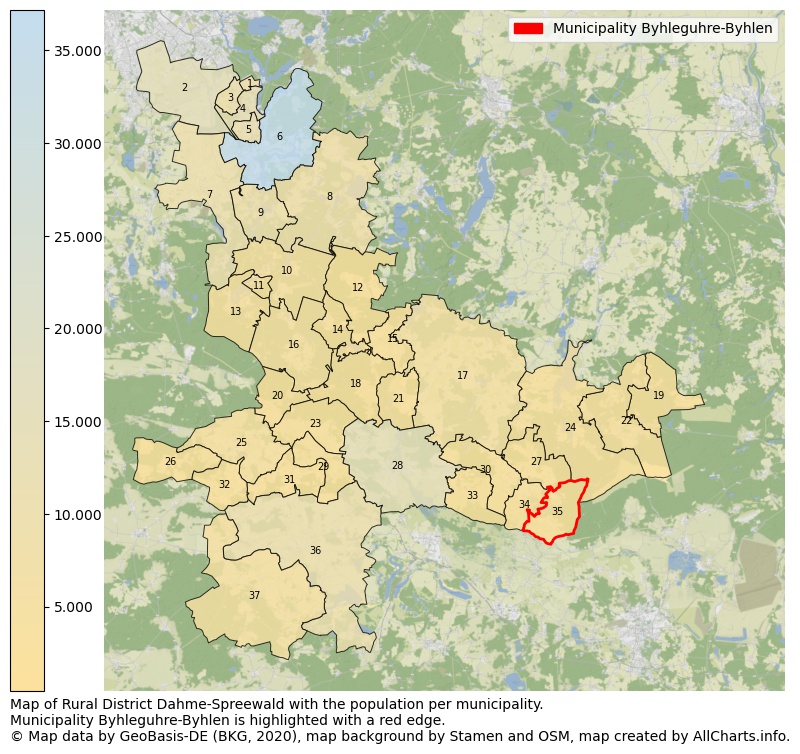
Map of Rural district Dahme-Spreewald with the population per municipality.Municipality Byhleguhre-Byhlen is highlighted with a red edge. The numbers at the map represent the following municipalities: 1: municipality Eichwalde, 2: municipality Schönefeld, 3: municipality Schulzendorf, 4: municipality Zeuthen, 5: municipality city Wildau ...Show more... Map of Rural district Dahme-Spreewald with the population per municipality.Municipality Byhleguhre-Byhlen is highlighted with a red edge. The numbers at the map represent the following municipalities: 1: municipality Eichwalde, 2: municipality Schönefeld, 3: municipality Schulzendorf, 4: municipality Zeuthen, 5: municipality city Wildau, 6: municipality city Königs Wusterhausen, 7: municipality city Mittenwalde, 8: municipality Heidesee, 9: municipality Bestensee, 10: municipality Groß Köris, 11: municipality Schwerin, 12: municipality Münchehofe, 13: municipality city Teupitz, 14: municipality city Märkisch Buchholz, 15: municipality Unterspreewald, 16: municipality Halbe, 17: municipality Märkische Heide, 18: municipality Krausnick-Groß Wasserburg, 19: municipality Jamlitz, 20: municipality Rietzneuendorf-Staakow, 21: municipality Schlepzig, 22: municipality city Lieberose, 23: municipality Schönwald, 24: municipality Schwielochsee, 25: municipality city Golßen, 26: municipality Steinreich, 27: municipality Spreewaldheide, 28: municipality city Lübben (Spreewald), 29: municipality Bersteland, 30: municipality Neu Zauche, 31: municipality Kasel-Golzig, 32: municipality Drahnsdorf, 33: municipality Alt Zauche-Wußwerk, 34: municipality Straupitz (Spreewald), 35: municipality Byhleguhre-Byhlen, 36: municipality city Luckau, 37: municipality Heideblick ...Show less...
One moment please, your device is loading the charts...
Municipality Byhleguhre-Byhlen, 2019, number of rooms per house.
The percentage shows the relative share of houses per category based on the numer of rooms: 1 to 2 rooms, 3 to 4 rooms or 5 rooms or more. This is based on the total number of rooms as identified for all dwellings in the municipality Byhleguhre-Byhlen.
The table below shows data for more than 100 topics as most recently available for the municipality Byhleguhre-Byhlen. Select a category to display the related topics:
| Business | Value | Unit | Year |
|---|---|---|---|
| Businesses | 1 | Number | 2017 |
| Active persons | 0 | Number | 2017 |
| Gross wages | €0 | Euro | 2017 |
| Dwellings | Value | Unit | Year |
|---|---|---|---|
| Houses 1 room | 2 | Number | 2019 |
| Houses 2 rooms | 10 | Number | 2019 |
| Houses 3 rooms | 67 | Number | 2019 |
| Houses 4 rooms | 108 | Number | 2019 |
| Houses 5 rooms | 75 | Number | 2019 |
| Houses 6 rooms | 71 | Number | 2019 |
| Houses 7+ rooms | 47 | Number | 2019 |
| Houses 1-2 rooms | 12 | Number | 2019 |
| Houses 3-4 rooms | 175 | Number | 2019 |
| Houses 5+ rooms | 193 | Number | 2019 |
| 1-2 rooms | 3% | Percentage | 2019 |
| 3-4 rooms | 46% | Percentage | 2019 |
| 5+ rooms | 51% | Percentage | 2019 |
| Elections | Value | Unit | Year |
|---|---|---|---|
| Voters Bundestag | 639,00 | Number | 2017 |
| Voter turnout Bundestag | 66 | Number | 2017 |
| Votes valid Bundestag | 411 | Number | 2017 |
| Votes Bundestag CDU/CSU | 130 | Number | 2017 |
| Votes Bundestag SPD | 54 | Number | 2017 |
| Votes Bundestag GRÜNE | 15 | Number | 2017 |
| Votes Bundestag FDP | 20 | Number | 2017 |
| Votes Bundestag DIE LINKE | 50 | Number | 2017 |
| Votes Bundestag AfD | 116 | Number | 2017 |
| Votes Bundestag other parties | 26 | Number | 2017 |
| Votes Bundestag total | 411 | Number | 2017 |
| % Votes Bundestag CDU/CSU | 20% | Percentage | 2017 |
| % Votes Bundestag SPD | 8% | Percentage | 2017 |
| % Votes Bundestag GRÜNE | 2% | Percentage | 2017 |
| % Votes Bundestag FDP | 3% | Percentage | 2017 |
| % Votes Bundestag DIE LINKE | 8% | Percentage | 2017 |
| % Votes Bundestag AfD | 18% | Percentage | 2017 |
| % Votes Bundestag other parties | 4% | Percentage | 2017 |
| Employment | Value | Unit | Year |
|---|---|---|---|
| Employees | 302 | Number | 2019 |
| Employees male | 158 | Number | 2019 |
| Employees female | 144 | Number | 2019 |
| Employees foreigner | 0 | Number | 2019 |
| Employees male foreigner | 0 | Number | 2019 |
| Employees female foreigner | 0 | Number | 2019 |
| Unemployed | 10 | Number | 2018 |
| Unemployed foreigners | 0 | Number | 2018 |
| Unemployed severely disabled | 1 | Number | 2018 |
| Unemployed 15-20 | 0 | Number | 2018 |
| Unemployed 15-25 | 0 | Number | 2018 |
| Unemployed 55-65 | 4 | Number | 2018 |
| Unemployed long-term | 4 | Number | 2018 |
| % Unemployed | 1% | Percentage | 2018 |
| % Unemployed foreigners | 0% | Percentage of the population | 2018 |
| % Unemployed severely disabled | 0% | Percentage of the population | 2018 |
| % Unemployed 15-20 | 0% | Percentage of the population | 2018 |
| % Unemployed 15-25 | 0% | Percentage of the population | 2018 |
| % Unemployed 55-65 | 1% | Percentage of the population | 2018 |
| % Unemployed long-term | 1% | Percentage of the population | 2018 |
| Income | Value | Unit | Year |
|---|---|---|---|
| Income receivers | 342 | Number | 2015 |
| Income total | €10.907 | Euro | 2015 |
| Income tax | €1.487 | Euro | 2015 |
| Population | Value | Unit | Year |
|---|---|---|---|
| Population | 732 | Number | 2019 |
| Men | 380 | Number | 2019 |
| Women | 352 | Number | 2019 |
| % Men | 52% | Percentage | 2019 |
| % Women | 48% | Percentage | 2019 |
| 0-18 | 96 | Number | 2019 |
| 18-30 | 48 | Number | 2019 |
| 30-45 | 118 | Number | 2019 |
| 45-60 | 203 | Number | 2019 |
| 18-60 | 369 | Number | 2019 |
| 60-75 | 163 | Number | 2019 |
| 60+ | 267 | Number | 2019 |
| Average age | 50 | Average number | 2019 |
| Average age male | 48 | Average number | 2019 |
| Average age female | 51 | Average number | 2019 |
| Births | 3 | Number | 2018 |
| Births male | 1 | Number | 2018 |
| Births female | 2 | Number | 2018 |
| 1K Births | 4 | Number per 1000 inhabitants | 2018 |
| Deaths | 14 | Number | 2018 |
| Deaths male | 7 | Number | 2018 |
| Deaths female | 7 | Number | 2018 |
| 1K Deaths | 19 | Number | 2018 |
| 0-3 | 11 | Number | 2019 |
| Girls 0-3 | 4 | Number | 2019 |
| Boys 0-3 | 7 | Number | 2019 |
| 3-6 | 19 | Number | 2019 |
| Girls 3-6 | 10 | Number | 2019 |
| Boys 3-6 | 9 | Number | 2019 |
| 6-10 | 18 | Number | 2019 |
| 10-15 | 30 | Number | 2019 |
| 15-18 | 18 | Number | 2019 |
| 18-20 | 11 | Number | 2019 |
| 20-25 | 20 | Number | 2019 |
| 25-30 | 17 | Number | 2019 |
| 30-35 | 40 | Number | 2019 |
| 35-40 | 40 | Number | 2019 |
| 40-45 | 38 | Number | 2019 |
| 45-50 | 65 | Number | 2019 |
| 50-55 | 66 | Number | 2019 |
| 55-60 | 72 | Number | 2019 |
| 60-65 | 78 | Number | 2019 |
| 65-75 | 85 | Number | 2019 |
| Women 65-70 | 45 | Number | 2019 |
| Men 65-70 | 40 | Number | 2019 |
| 75+ | 104 | Number | 2019 |
| Women 75+ | 61 | Number | 2019 |
| Men 75+ | 43 | Number | 2019 |
| % 0-10 | 7% | Percentage | 2019 |
| % 10-18 | 7% | Percentage | 2019 |
| % 18-30 | 7% | Percentage | 2019 |
| % 30-45 | 16% | Percentage | 2019 |
| % 45-60 | 28% | Percentage | 2019 |
| % 60+ | 36% | Percentage | 2019 |
| Real estate | Value | Unit | Year |
|---|---|---|---|
| Property tax A revenue | no data | Euro | no data |
| Property tax B revenue | no data | Euro | no data |
| Trade tax actual revenue | no data | Euro | no data |
| Property tax A basic amount | no data | Euro | no data |
| Property tax B basic amount | no data | Euro | no data |
| Trade tax basic amount | no data | Euro | no data |
| Property tax A rate | no data | Euro | no data |
| Property tax B rate | no data | Euro | no data |
| Trade tax rate | no data | Euro | no data |
| Real tax raising force | no data | Euro | no data |
| Trade tax levy | no data | Euro | no data |
| Trade tax net | no data | Euro | no data |
| Community share in income tax | no data | Euro | no data |
| Community share in sales tax | no data | Euro | no data |
| Tax revenue | no data | Euro | no data |
| Regional | Value | Unit | Year |
|---|---|---|---|
| Region code | 120615113061 | Code | 2019 |
| Region code 8 digits | 12061061 | Code | 12061061 |
| Sorting code | 120615113061 | Code | 120615113061 |
| Sorting code 8 digits | 12061061 | Code | 12061061 |
| Region name | Byhleguhre-Byhlen | Name | 2019 |
| Regional level | 6 | Categorical type | 2019 |
| Region type | Municipality | Categorical type | 2019 |
| Region type detail | municipality | Categorical type | 2019 |
| Region name with type | municipality Byhleguhre-Byhlen | Name | 2019 |
| Region name in German | Gemeinde Byhleguhre-Byhlen | Name | 2019 |
| Direct subregions | no data | Number | 2019 |
| NUTS code | DE406 | Code | 2019 |
| Area | 36 | Area in km² | 2019 |
| Religion | Value | Unit | Year |
|---|---|---|---|
| Roman Catholic church | 9 | Number | 2011 |
| Protestant church | 334 | Number | 2011 |
| Other or none | 444 | Number | 2011 |
| % Roman Catholic church | 1% | Percentage | 2011 |
| % Protestant church | 42% | Percentage | 2011 |
| % Other or none | 56% | Percentage | 2011 |
| Roman Catholic church German | 6 | Number | 2011 |
| Protestant church German | 334 | Number | 2011 |
| Other or none German | 444 | Number | 2011 |
| % Roman Catholic church German | 1% | Percentage | 2011 |
| % Protestant church German | 43% | Percentage | 2011 |
| % Other or none German Foreign | 57% | Percentage | 2011 |
| Roman Catholic church Foreign | 3 | Number | 2011 |
| Protestant church Foreign | 0 | Number | 2011 |
| Other or none Foreign | 0 | Number | 2011 |
| % Roman Catholic church Foreign | 100% | Percentage | 2011 |
| % Protestant church Foreign | 0% | Percentage | 2011 |
| % Other or none Foreign | 0% | Percentage | 2011 |
Data is used from multiple German open data providers. See this description of the sources with the definitions of all regional topics.
Sources & definitionsThis page will be further expanded with more topics in clear graphs. This will be done in several iterations in the coming weeks.
![]()
© Published:
 Contents and more information: