One moment please, your device is loading the charts...
Population numbers in the municipality city Geiselhöring for the years 2009 thru 2019.
The number of inhabitants is the number of persons as registered in the population register on January 1st.
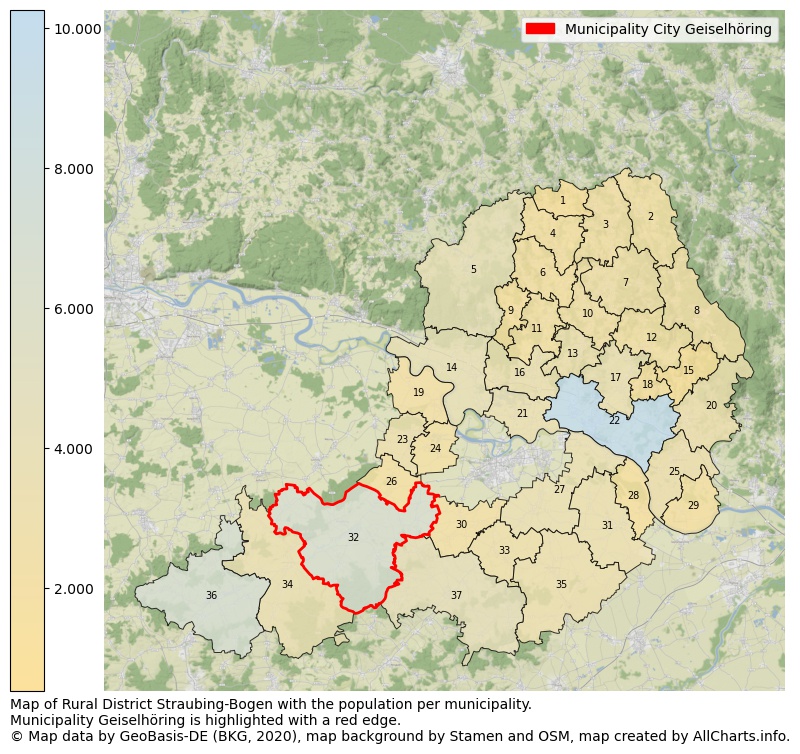
Map of Rural district Straubing-Bogen with the population per municipality.Municipality Geiselhöring is highlighted with a red edge. The numbers at the map represent the following municipalities: 1: municipality Loitzendorf, 2: municipality Rattenberg, 3: municipality Konzell, 4: municipality Stallwang, 5: municipality Wiesenfelden ...Show more... Map of Rural district Straubing-Bogen with the population per municipality.Municipality Geiselhöring is highlighted with a red edge. The numbers at the map represent the following municipalities: 1: municipality Loitzendorf, 2: municipality Rattenberg, 3: municipality Konzell, 4: municipality Stallwang, 5: municipality Wiesenfelden, 6: municipality Rattiszell, 7: municipality Haibach, 8: municipality Sankt Englmar, 9: municipality Falkenfels, 10: municipality Haselbach, 11: municipality Ascha, 12: municipality Neukirchen, 13: municipality Mitterfels, 14: municipality Kirchroth, 15: municipality Perasdorf, 16: municipality Steinach, 17: municipality Hunderdorf, 18: municipality Windberg, 19: municipality Aholfing, 20: municipality Schwarzach, 21: municipality Parkstetten, 22: municipality city Bogen, 23: municipality Rain, 24: municipality Atting, 25: municipality Niederwinkling, 26: municipality Perkam, 27: municipality Aiterhofen, 28: municipality Irlbach, 29: municipality Mariaposching, 30: municipality Feldkirchen, 31: municipality Straßkirchen, 32: municipality city Geiselhöring, 33: municipality Salching, 34: municipality Laberweinting, 35: municipality Oberschneiding, 36: municipality Mallersdorf-Pfaffenberg, 37: municipality Leiblfing ...Show less...
One moment please, your device is loading the charts...
Municipality city Geiselhöring, 2019, number of rooms per house.
The percentage shows the relative share of houses per category based on the numer of rooms: 1 to 2 rooms, 3 to 4 rooms or 5 rooms or more. This is based on the total number of rooms as identified for all dwellings in the municipality city Geiselhöring.
The table below shows data for more than 100 topics as most recently available for the municipality city Geiselhöring. Select a category to display the related topics:
| Business | Value | Unit | Year |
|---|---|---|---|
| Businesses | 7 | Number | 2017 |
| Active persons | 986 | Number | 2017 |
| Gross wages | €22.682 | Euro | 2017 |
| Dwellings | Value | Unit | Year |
|---|---|---|---|
| Houses 1 room | 19 | Number | 2019 |
| Houses 2 rooms | 106 | Number | 2019 |
| Houses 3 rooms | 238 | Number | 2019 |
| Houses 4 rooms | 405 | Number | 2019 |
| Houses 5 rooms | 557 | Number | 2019 |
| Houses 6 rooms | 591 | Number | 2019 |
| Houses 7+ rooms | 980 | Number | 2019 |
| Houses 1-2 rooms | 125 | Number | 2019 |
| Houses 3-4 rooms | 643 | Number | 2019 |
| Houses 5+ rooms | 2.128 | Number | 2019 |
| 1-2 rooms | 4% | Percentage | 2019 |
| 3-4 rooms | 22% | Percentage | 2019 |
| 5+ rooms | 73% | Percentage | 2019 |
| Elections | Value | Unit | Year |
|---|---|---|---|
| Voters Bundestag | 5040,00 | Number | 2017 |
| Voter turnout Bundestag | 77 | Number | 2017 |
| Votes valid Bundestag | 3.875 | Number | 2017 |
| Votes Bundestag CDU/CSU | 1.853 | Number | 2017 |
| Votes Bundestag SPD | 435 | Number | 2017 |
| Votes Bundestag GRÜNE | 162 | Number | 2017 |
| Votes Bundestag FDP | 309 | Number | 2017 |
| Votes Bundestag DIE LINKE | 127 | Number | 2017 |
| Votes Bundestag AfD | 603 | Number | 2017 |
| Votes Bundestag other parties | 386 | Number | 2017 |
| Votes Bundestag total | 3.875 | Number | 2017 |
| % Votes Bundestag CDU/CSU | 37% | Percentage | 2017 |
| % Votes Bundestag SPD | 9% | Percentage | 2017 |
| % Votes Bundestag GRÜNE | 3% | Percentage | 2017 |
| % Votes Bundestag FDP | 6% | Percentage | 2017 |
| % Votes Bundestag DIE LINKE | 3% | Percentage | 2017 |
| % Votes Bundestag AfD | 12% | Percentage | 2017 |
| % Votes Bundestag other parties | 8% | Percentage | 2017 |
| Employment | Value | Unit | Year |
|---|---|---|---|
| Employees | 2.899 | Number | 2019 |
| Employees male | 1.622 | Number | 2019 |
| Employees female | 1.277 | Number | 2019 |
| Employees foreigner | 557 | Number | 2019 |
| Employees male foreigner | 363 | Number | 2019 |
| Employees female foreigner | 194 | Number | 2019 |
| Unemployed | 140 | Number | 2018 |
| Unemployed foreigners | 42 | Number | 2018 |
| Unemployed severely disabled | 10 | Number | 2018 |
| Unemployed 15-20 | 2 | Number | 2018 |
| Unemployed 15-25 | 17 | Number | 2018 |
| Unemployed 55-65 | 35 | Number | 2018 |
| Unemployed long-term | 37 | Number | 2018 |
| % Unemployed | 2% | Percentage | 2018 |
| % Unemployed foreigners | 1% | Percentage of the population | 2018 |
| % Unemployed severely disabled | 0% | Percentage of the population | 2018 |
| % Unemployed 15-20 | 0% | Percentage of the population | 2018 |
| % Unemployed 15-25 | 0% | Percentage of the population | 2018 |
| % Unemployed 55-65 | 1% | Percentage of the population | 2018 |
| % Unemployed long-term | 1% | Percentage of the population | 2018 |
| Income | Value | Unit | Year |
|---|---|---|---|
| Income receivers | 3.318 | Number | 2015 |
| Income total | €131.150 | Euro | 2015 |
| Income tax | €21.614 | Euro | 2015 |
| Population | Value | Unit | Year |
|---|---|---|---|
| Population | 6.860 | Number | 2019 |
| Men | 3.505 | Number | 2019 |
| Women | 3.355 | Number | 2019 |
| % Men | 51% | Percentage | 2019 |
| % Women | 49% | Percentage | 2019 |
| 0-18 | 1.138 | Number | 2019 |
| 18-30 | 910 | Number | 2019 |
| 30-45 | 1.328 | Number | 2019 |
| 45-60 | 1.654 | Number | 2019 |
| 18-60 | 3.892 | Number | 2019 |
| 60-75 | 1.128 | Number | 2019 |
| 60+ | 1.830 | Number | 2019 |
| Average age | 44 | Average number | 2019 |
| Average age male | 43 | Average number | 2019 |
| Average age female | 45 | Average number | 2019 |
| Births | 48 | Number | 2018 |
| Births male | 24 | Number | 2018 |
| Births female | 24 | Number | 2018 |
| 1K Births | 7 | Number per 1000 inhabitants | 2018 |
| Deaths | 82 | Number | 2018 |
| Deaths male | 43 | Number | 2018 |
| Deaths female | 39 | Number | 2018 |
| 1K Deaths | 12 | Number | 2018 |
| 0-3 | 167 | Number | 2019 |
| Girls 0-3 | 81 | Number | 2019 |
| Boys 0-3 | 86 | Number | 2019 |
| 3-6 | 203 | Number | 2019 |
| Girls 3-6 | 95 | Number | 2019 |
| Boys 3-6 | 108 | Number | 2019 |
| 6-10 | 257 | Number | 2019 |
| 10-15 | 327 | Number | 2019 |
| 15-18 | 184 | Number | 2019 |
| 18-20 | 136 | Number | 2019 |
| 20-25 | 355 | Number | 2019 |
| 25-30 | 419 | Number | 2019 |
| 30-35 | 411 | Number | 2019 |
| 35-40 | 452 | Number | 2019 |
| 40-45 | 465 | Number | 2019 |
| 45-50 | 503 | Number | 2019 |
| 50-55 | 586 | Number | 2019 |
| 55-60 | 565 | Number | 2019 |
| 60-65 | 463 | Number | 2019 |
| 65-75 | 665 | Number | 2019 |
| Women 65-70 | 340 | Number | 2019 |
| Men 65-70 | 325 | Number | 2019 |
| 75+ | 702 | Number | 2019 |
| Women 75+ | 397 | Number | 2019 |
| Men 75+ | 305 | Number | 2019 |
| % 0-10 | 9% | Percentage | 2019 |
| % 10-18 | 7% | Percentage | 2019 |
| % 18-30 | 13% | Percentage | 2019 |
| % 30-45 | 19% | Percentage | 2019 |
| % 45-60 | 24% | Percentage | 2019 |
| % 60+ | 27% | Percentage | 2019 |
| Real estate | Value | Unit | Year |
|---|---|---|---|
| Property tax A revenue | no data | Euro | no data |
| Property tax B revenue | no data | Euro | no data |
| Trade tax actual revenue | no data | Euro | no data |
| Property tax A basic amount | no data | Euro | no data |
| Property tax B basic amount | no data | Euro | no data |
| Trade tax basic amount | no data | Euro | no data |
| Property tax A rate | no data | Euro | no data |
| Property tax B rate | no data | Euro | no data |
| Trade tax rate | no data | Euro | no data |
| Real tax raising force | no data | Euro | no data |
| Trade tax levy | no data | Euro | no data |
| Trade tax net | no data | Euro | no data |
| Community share in income tax | no data | Euro | no data |
| Community share in sales tax | no data | Euro | no data |
| Tax revenue | no data | Euro | no data |
| Regional | Value | Unit | Year |
|---|---|---|---|
| Region code | 092780123123 | Code | 2019 |
| Region code 8 digits | 09278123 | Code | 09278123 |
| Sorting code | 092780123123 | Code | 092780123123 |
| Sorting code 8 digits | 09278123 | Code | 09278123 |
| Region name | Geiselhöring | Name | 2019 |
| Regional level | 6 | Categorical type | 2019 |
| Region type | Municipality | Categorical type | 2019 |
| Region type detail | municipality city | Categorical type | 2019 |
| Region name with type | municipality city Geiselhöring | Name | 2019 |
| Region name in German | Gemeinde Stadt Geiselhöring | Name | 2019 |
| Direct subregions | no data | Number | 2019 |
| NUTS code | DE22B | Code | 2019 |
| Area | 100 | Area in km² | 2019 |
| Religion | Value | Unit | Year |
|---|---|---|---|
| Roman Catholic church | 5.158 | Number | 2011 |
| Protestant church | 516 | Number | 2011 |
| Other or none | 856 | Number | 2011 |
| % Roman Catholic church | 79% | Percentage | 2011 |
| % Protestant church | 8% | Percentage | 2011 |
| % Other or none | 13% | Percentage | 2011 |
| Roman Catholic church German | 4.982 | Number | 2011 |
| Protestant church German | 504 | Number | 2011 |
| Other or none German | 614 | Number | 2011 |
| % Roman Catholic church German | 82% | Percentage | 2011 |
| % Protestant church German | 8% | Percentage | 2011 |
| % Other or none German Foreign | 10% | Percentage | 2011 |
| Roman Catholic church Foreign | 176 | Number | 2011 |
| Protestant church Foreign | 12 | Number | 2011 |
| Other or none Foreign | 242 | Number | 2011 |
| % Roman Catholic church Foreign | 41% | Percentage | 2011 |
| % Protestant church Foreign | 3% | Percentage | 2011 |
| % Other or none Foreign | 56% | Percentage | 2011 |
Data is used from multiple German open data providers. See this description of the sources with the definitions of all regional topics.
Sources & definitionsThis page will be further expanded with more topics in clear graphs. This will be done in several iterations in the coming weeks.
![]()
© Published:
 Contents and more information: