One moment please, your device is loading the charts...
Population numbers in the municipality city Mühlberg/Elbe for the years 2009 thru 2019.
The number of inhabitants is the number of persons as registered in the population register on January 1st.
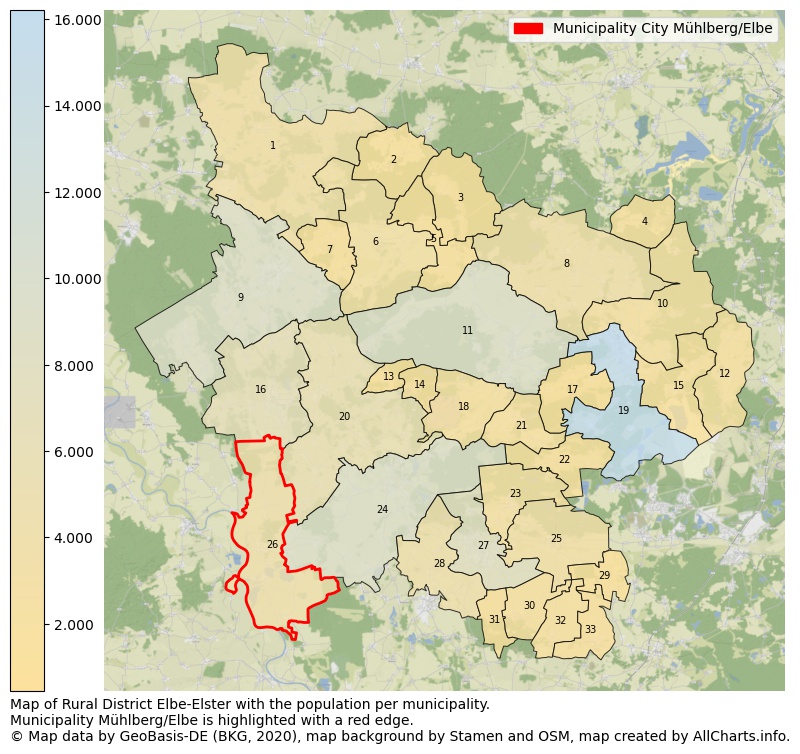
Map of Rural district Elbe-Elster with the population per municipality.Municipality Mühlberg/Elbe is highlighted with a red edge. The numbers at the map represent the following municipalities: 1: municipality city Schönewalde, 2: municipality Lebusa, 3: municipality Hohenbucko, 4: municipality Crinitz, 5: municipality Fichtwald ...Show more... Map of Rural district Elbe-Elster with the population per municipality.Municipality Mühlberg/Elbe is highlighted with a red edge. The numbers at the map represent the following municipalities: 1: municipality city Schönewalde, 2: municipality Lebusa, 3: municipality Hohenbucko, 4: municipality Crinitz, 5: municipality Fichtwald, 6: municipality city Schlieben, 7: municipality Kremitzaue, 8: municipality city Sonnewalde, 9: municipality city Herzberg (Elster), 10: municipality Massen-Niederlausitz, 11: municipality city Doberlug-Kirchhain, 12: municipality Sallgast, 13: municipality Schilda, 14: municipality Tröbitz, 15: municipality Lichterfeld-Schacksdorf, 16: municipality city Falkenberg/Elster, 17: municipality Heideland, 18: municipality Schönborn, 19: municipality city Finsterwalde, 20: municipality city Uebigau-Wahrenbrück, 21: municipality Rückersdorf, 22: municipality Gorden-Staupitz, 23: municipality Hohenleipisch, 24: municipality city Bad Liebenwerda, 25: municipality Plessa, 26: municipality city Mühlberg/Elbe, 27: municipality city Elsterwerda, 28: municipality Röderland, 29: municipality Schraden, 30: municipality Gröden, 31: municipality Merzdorf, 32: municipality Hirschfeld, 33: municipality Großthiemig ...Show less...
One moment please, your device is loading the charts...
Municipality city Mühlberg/Elbe, 2019, number of rooms per house.
The percentage shows the relative share of houses per category based on the numer of rooms: 1 to 2 rooms, 3 to 4 rooms or 5 rooms or more. This is based on the total number of rooms as identified for all dwellings in the municipality city Mühlberg/Elbe.
The table below shows data for more than 100 topics as most recently available for the municipality city Mühlberg/Elbe. Select a category to display the related topics:
| Business | Value | Unit | Year |
|---|---|---|---|
| Businesses | 3 | Number | 2017 |
| Active persons | 205 | Number | 2017 |
| Gross wages | €8.353 | Euro | 2017 |
| Dwellings | Value | Unit | Year |
|---|---|---|---|
| Houses 1 room | 11 | Number | 2019 |
| Houses 2 rooms | 113 | Number | 2019 |
| Houses 3 rooms | 402 | Number | 2019 |
| Houses 4 rooms | 599 | Number | 2019 |
| Houses 5 rooms | 456 | Number | 2019 |
| Houses 6 rooms | 308 | Number | 2019 |
| Houses 7+ rooms | 262 | Number | 2019 |
| Houses 1-2 rooms | 124 | Number | 2019 |
| Houses 3-4 rooms | 1.001 | Number | 2019 |
| Houses 5+ rooms | 1.026 | Number | 2019 |
| 1-2 rooms | 6% | Percentage | 2019 |
| 3-4 rooms | 47% | Percentage | 2019 |
| 5+ rooms | 48% | Percentage | 2019 |
| Elections | Value | Unit | Year |
|---|---|---|---|
| Voters Bundestag | 3317,00 | Number | 2017 |
| Voter turnout Bundestag | 74 | Number | 2017 |
| Votes valid Bundestag | 2.392 | Number | 2017 |
| Votes Bundestag CDU/CSU | 673 | Number | 2017 |
| Votes Bundestag SPD | 419 | Number | 2017 |
| Votes Bundestag GRÜNE | 41 | Number | 2017 |
| Votes Bundestag FDP | 152 | Number | 2017 |
| Votes Bundestag DIE LINKE | 324 | Number | 2017 |
| Votes Bundestag AfD | 616 | Number | 2017 |
| Votes Bundestag other parties | 167 | Number | 2017 |
| Votes Bundestag total | 2.392 | Number | 2017 |
| % Votes Bundestag CDU/CSU | 20% | Percentage | 2017 |
| % Votes Bundestag SPD | 13% | Percentage | 2017 |
| % Votes Bundestag GRÜNE | 1% | Percentage | 2017 |
| % Votes Bundestag FDP | 5% | Percentage | 2017 |
| % Votes Bundestag DIE LINKE | 10% | Percentage | 2017 |
| % Votes Bundestag AfD | 19% | Percentage | 2017 |
| % Votes Bundestag other parties | 5% | Percentage | 2017 |
| Employment | Value | Unit | Year |
|---|---|---|---|
| Employees | 1.277 | Number | 2019 |
| Employees male | 692 | Number | 2019 |
| Employees female | 585 | Number | 2019 |
| Employees foreigner | 4 | Number | 2019 |
| Employees male foreigner | 0 | Number | 2019 |
| Employees female foreigner | 0 | Number | 2019 |
| Unemployed | 130 | Number | 2018 |
| Unemployed foreigners | 0 | Number | 2018 |
| Unemployed severely disabled | 6 | Number | 2018 |
| Unemployed 15-20 | 0 | Number | 2018 |
| Unemployed 15-25 | 3 | Number | 2018 |
| Unemployed 55-65 | 47 | Number | 2018 |
| Unemployed long-term | 51 | Number | 2018 |
| % Unemployed | 3% | Percentage | 2018 |
| % Unemployed foreigners | 0% | Percentage of the population | 2018 |
| % Unemployed severely disabled | 0% | Percentage of the population | 2018 |
| % Unemployed 15-20 | 0% | Percentage of the population | 2018 |
| % Unemployed 15-25 | 0% | Percentage of the population | 2018 |
| % Unemployed 55-65 | 1% | Percentage of the population | 2018 |
| % Unemployed long-term | 1% | Percentage of the population | 2018 |
| Income | Value | Unit | Year |
|---|---|---|---|
| Income receivers | 1.575 | Number | 2015 |
| Income total | €42.970 | Euro | 2015 |
| Income tax | €5.202 | Euro | 2015 |
| Population | Value | Unit | Year |
|---|---|---|---|
| Population | 3.734 | Number | 2019 |
| Men | 1.850 | Number | 2019 |
| Women | 1.884 | Number | 2019 |
| % Men | 50% | Percentage | 2019 |
| % Women | 50% | Percentage | 2019 |
| 0-18 | 451 | Number | 2019 |
| 18-30 | 262 | Number | 2019 |
| 30-45 | 551 | Number | 2019 |
| 45-60 | 977 | Number | 2019 |
| 18-60 | 1.790 | Number | 2019 |
| 60-75 | 821 | Number | 2019 |
| 60+ | 1.493 | Number | 2019 |
| Average age | 52 | Average number | 2019 |
| Average age male | 50 | Average number | 2019 |
| Average age female | 53 | Average number | 2019 |
| Births | 15 | Number | 2018 |
| Births male | 8 | Number | 2018 |
| Births female | 7 | Number | 2018 |
| 1K Births | 4 | Number per 1000 inhabitants | 2018 |
| Deaths | 68 | Number | 2018 |
| Deaths male | 35 | Number | 2018 |
| Deaths female | 33 | Number | 2018 |
| 1K Deaths | 18 | Number | 2018 |
| 0-3 | 62 | Number | 2019 |
| Girls 0-3 | 34 | Number | 2019 |
| Boys 0-3 | 28 | Number | 2019 |
| 3-6 | 69 | Number | 2019 |
| Girls 3-6 | 34 | Number | 2019 |
| Boys 3-6 | 35 | Number | 2019 |
| 6-10 | 101 | Number | 2019 |
| 10-15 | 131 | Number | 2019 |
| 15-18 | 88 | Number | 2019 |
| 18-20 | 37 | Number | 2019 |
| 20-25 | 95 | Number | 2019 |
| 25-30 | 130 | Number | 2019 |
| 30-35 | 196 | Number | 2019 |
| 35-40 | 169 | Number | 2019 |
| 40-45 | 186 | Number | 2019 |
| 45-50 | 248 | Number | 2019 |
| 50-55 | 339 | Number | 2019 |
| 55-60 | 390 | Number | 2019 |
| 60-65 | 341 | Number | 2019 |
| 65-75 | 480 | Number | 2019 |
| Women 65-70 | 250 | Number | 2019 |
| Men 65-70 | 230 | Number | 2019 |
| 75+ | 672 | Number | 2019 |
| Women 75+ | 396 | Number | 2019 |
| Men 75+ | 276 | Number | 2019 |
| % 0-10 | 6% | Percentage | 2019 |
| % 10-18 | 6% | Percentage | 2019 |
| % 18-30 | 7% | Percentage | 2019 |
| % 30-45 | 15% | Percentage | 2019 |
| % 45-60 | 26% | Percentage | 2019 |
| % 60+ | 40% | Percentage | 2019 |
| Real estate | Value | Unit | Year |
|---|---|---|---|
| Property tax A revenue | no data | Euro | no data |
| Property tax B revenue | no data | Euro | no data |
| Trade tax actual revenue | no data | Euro | no data |
| Property tax A basic amount | no data | Euro | no data |
| Property tax B basic amount | no data | Euro | no data |
| Trade tax basic amount | no data | Euro | no data |
| Property tax A rate | no data | Euro | no data |
| Property tax B rate | no data | Euro | no data |
| Trade tax rate | no data | Euro | no data |
| Real tax raising force | no data | Euro | no data |
| Trade tax levy | no data | Euro | no data |
| Trade tax net | no data | Euro | no data |
| Community share in income tax | no data | Euro | no data |
| Community share in sales tax | no data | Euro | no data |
| Tax revenue | no data | Euro | no data |
| Regional | Value | Unit | Year |
|---|---|---|---|
| Region code | 120620341341 | Code | 2019 |
| Region code 8 digits | 12062341 | Code | 12062341 |
| Sorting code | 120620341341 | Code | 120620341341 |
| Sorting code 8 digits | 12062341 | Code | 12062341 |
| Region name | Mühlberg/Elbe | Name | 2019 |
| Regional level | 6 | Categorical type | 2019 |
| Region type | Municipality | Categorical type | 2019 |
| Region type detail | municipality city | Categorical type | 2019 |
| Region name with type | municipality city Mühlberg/Elbe | Name | 2019 |
| Region name in German | Gemeinde Stadt Mühlberg/Elbe | Name | 2019 |
| Direct subregions | no data | Number | 2019 |
| NUTS code | DE407 | Code | 2019 |
| Area | 89 | Area in km² | 2019 |
| Religion | Value | Unit | Year |
|---|---|---|---|
| Roman Catholic church | 215 | Number | 2011 |
| Protestant church | 1.137 | Number | 2011 |
| Other or none | 2.828 | Number | 2011 |
| % Roman Catholic church | 5% | Percentage | 2011 |
| % Protestant church | 27% | Percentage | 2011 |
| % Other or none | 68% | Percentage | 2011 |
| Roman Catholic church German | 215 | Number | 2011 |
| Protestant church German | 1.134 | Number | 2011 |
| Other or none German | 2.807 | Number | 2011 |
| % Roman Catholic church German | 5% | Percentage | 2011 |
| % Protestant church German | 27% | Percentage | 2011 |
| % Other or none German Foreign | 68% | Percentage | 2011 |
| Roman Catholic church Foreign | 0 | Number | 2011 |
| Protestant church Foreign | 3 | Number | 2011 |
| Other or none Foreign | 21 | Number | 2011 |
| % Roman Catholic church Foreign | 0% | Percentage | 2011 |
| % Protestant church Foreign | 12% | Percentage | 2011 |
| % Other or none Foreign | 88% | Percentage | 2011 |
Data is used from multiple German open data providers. See this description of the sources with the definitions of all regional topics.
Sources & definitionsThis page will be further expanded with more topics in clear graphs. This will be done in several iterations in the coming weeks.
![]()
© Published:
 Contents and more information: