Population numbers per year
The number of inhabitants in the municipality city Niebüll
One moment please, your device is loading the charts...
Population numbers in the municipality city Niebüll for the years 2009 thru 2019.
The number of inhabitants is the number of persons as registered in the population register on January 1st.
Population at the map of Niebüll
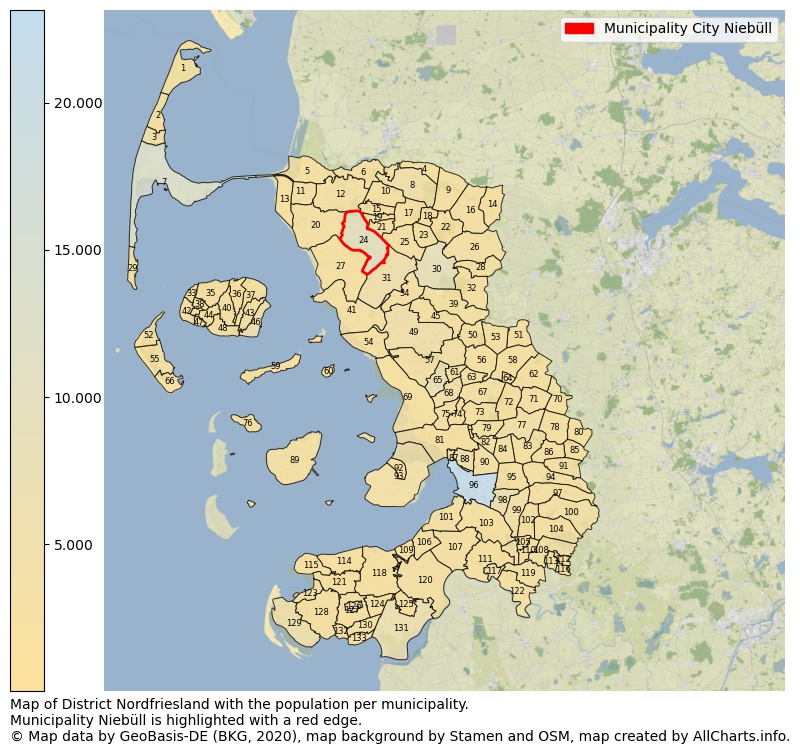
Map of District Nordfriesland with the population per municipality.Municipality Niebüll is highlighted with a red edge. The numbers at the map represent the following municipalities: 1: municipality List auf Sylt, 2: municipality Kampen (Sylt), 3: municipality Wenningstedt-Braderup (Sylt), 4: municipality Ellhöft, 5: municipality Rodenäs ...Show more... Map of District Nordfriesland with the population per municipality.Municipality Niebüll is highlighted with a red edge. The numbers at the map represent the following municipalities: 1: municipality List auf Sylt, 2: municipality Kampen (Sylt), 3: municipality Wenningstedt-Braderup (Sylt), 4: municipality Ellhöft, 5: municipality Rodenäs, 6: municipality Aventoft, 7: municipality Sylt, 8: municipality Süderlügum, 9: municipality Westre, 10: municipality Humptrup, 11: municipality Klanxbüll, 12: municipality Neukirchen, 13: municipality Friedrich-Wilhelm-Lübke-Koog, 14: municipality Bramstedtlund, 15: municipality Uphusum, 16: municipality Ladelund, 17: municipality Braderup, 18: municipality Lexgaard, 19: municipality Holm, 20: municipality Emmelsbüll-Horsbüll, 21: municipality Bosbüll, 22: municipality Karlum, 23: municipality Tinningstedt, 24: municipality city Niebüll, 25: municipality Klixbüll, 26: municipality Achtrup, 27: municipality Galmsbüll, 28: municipality Sprakebüll, 29: municipality Hörnum (Sylt), 30: municipality Leck, 31: municipality Risum-Lindholm, 32: municipality Stadum, 33: municipality Dunsum, 34: municipality Stedesand, 35: municipality Oldsum, 36: municipality Midlum, 37: municipality Oevenum, 38: municipality Süderende, 39: municipality Enge-Sande, 40: municipality Alkersum, 41: municipality Dagebüll, 42: municipality Utersum, 43: municipality Wrixum, 44: municipality Borgsum, 45: municipality Bargum, 46: municipality city Wyk auf Föhr, 47: municipality Witsum, 48: municipality Nieblum, 49: municipality Langenhorn, 50: municipality Lütjenholm, 51: municipality Goldebek, 52: municipality Norddorf auf Amrum, 53: municipality Goldelund, 54: municipality Ockholm, 55: municipality Nebel, 56: municipality Högel, 57: municipality Bordelum, 58: municipality Joldelund, 59: municipality Langeneß, 60: municipality Gröde, 61: municipality Sönnebüll, 62: municipality Löwenstedt, 63: municipality Vollstedt, 64: municipality Kolkerheide, 65: municipality city Bredstedt, 66: municipality Wittdün auf Amrum, 67: municipality Drelsdorf, 68: municipality Breklum, 69: municipality Reußenköge, 70: municipality Sollwitt, 71: municipality Haselund, 72: municipality Norstedt, 73: municipality Bohmstedt, 74: municipality Almdorf, 75: municipality Struckum, 76: municipality Hallig Hooge, 77: municipality Viöl, 78: municipality Behrendorf, 79: municipality Ahrenshöft, 80: municipality Bondelum, 81: municipality Hattstedtermarsch, 82: municipality Arlewatt, 83: municipality Immenstedt, 84: municipality Olderup, 85: municipality Ahrenviölfeld, 86: municipality Ahrenviöl, 87: municipality Wobbenbüll, 88: municipality Hattstedt, 89: municipality Pellworm, 90: municipality Horstedt, 91: municipality Oster-Ohrstedt, 92: municipality Elisabeth-Sophien-Koog, 93: municipality Nordstrand, 94: municipality Wester-Ohrstedt, 95: municipality Schwesing, 96: municipality city Husum, 97: municipality Wittbek, 98: municipality Mildstedt, 99: municipality Rantrum, 100: municipality Ostenfeld (Husum), 101: municipality Simonsberg, 102: municipality Oldersbek, 103: municipality Südermarsch, 104: municipality Winnert, 105: municipality Wisch, 106: municipality Uelvesbüll, 107: municipality Witzwort, 108: municipality Schwabstedt, 109: municipality Norderfriedrichskoog, 110: municipality Ramstedt, 111: municipality Koldenbüttel, 112: municipality Fresendelf, 113: municipality Hude, 114: municipality Osterhever, 115: municipality Westerhever, 116: municipality Süderhöft, 117: municipality city Friedrichstadt, 118: municipality Tetenbüll, 119: municipality Seeth, 120: municipality Oldenswort, 121: municipality Poppenbüll, 122: municipality Drage, 123: municipality Tümlauer Koog, 124: municipality Katharinenheerd, 125: municipality Kotzenbüll, 126: municipality city Garding, 127: municipality Kirchspiel Garding, 128: municipality Tating, 129: municipality Sankt Peter-Ording, 130: municipality Welt, 131: municipality city Tönning, 132: municipality Grothusenkoog, 133: municipality Vollerwiek ...Show less...
The number of rooms per house (dwelling)
The number of rooms of the houses in the municipality city Niebüll
One moment please, your device is loading the charts...
Municipality city Niebüll, 2019, number of rooms per house.
The percentage shows the relative share of houses per category based on the numer of rooms: 1 to 2 rooms, 3 to 4 rooms or 5 rooms or more. This is based on the total number of rooms as identified for all dwellings in the municipality city Niebüll.
Data about more than 100 topics!
The table below shows data for more than 100 topics as most recently available for the municipality city Niebüll. Select a category to display the related topics:
| Business | Value | Unit | Year |
|---|---|---|---|
| Businesses | 5 | Number | 2017 |
| Active persons | 410 | Number | 2017 |
| Gross wages | €16.452 | Euro | 2017 |
| Dwellings | Value | Unit | Year |
|---|---|---|---|
| Houses 1 room | 80 | Number | 2019 |
| Houses 2 rooms | 490 | Number | 2019 |
| Houses 3 rooms | 984 | Number | 2019 |
| Houses 4 rooms | 1.203 | Number | 2019 |
| Houses 5 rooms | 957 | Number | 2019 |
| Houses 6 rooms | 723 | Number | 2019 |
| Houses 7+ rooms | 918 | Number | 2019 |
| Houses 1-2 rooms | 570 | Number | 2019 |
| Houses 3-4 rooms | 2.187 | Number | 2019 |
| Houses 5+ rooms | 2.598 | Number | 2019 |
| 1-2 rooms | 11% | Percentage | 2019 |
| 3-4 rooms | 41% | Percentage | 2019 |
| 5+ rooms | 49% | Percentage | 2019 |
| Elections | Value | Unit | Year |
|---|---|---|---|
| Voters Bundestag | 7646,00 | Number | 2017 |
| Voter turnout Bundestag | 57 | Number | 2017 |
| Votes valid Bundestag | 4.293 | Number | 2017 |
| Votes Bundestag CDU/CSU | 1.535 | Number | 2017 |
| Votes Bundestag SPD | 1.044 | Number | 2017 |
| Votes Bundestag GRÜNE | 593 | Number | 2017 |
| Votes Bundestag FDP | 447 | Number | 2017 |
| Votes Bundestag DIE LINKE | 313 | Number | 2017 |
| Votes Bundestag AfD | 267 | Number | 2017 |
| Votes Bundestag other parties | 94 | Number | 2017 |
| Votes Bundestag total | 4.293 | Number | 2017 |
| % Votes Bundestag CDU/CSU | 20% | Percentage | 2017 |
| % Votes Bundestag SPD | 14% | Percentage | 2017 |
| % Votes Bundestag GRÜNE | 8% | Percentage | 2017 |
| % Votes Bundestag FDP | 6% | Percentage | 2017 |
| % Votes Bundestag DIE LINKE | 4% | Percentage | 2017 |
| % Votes Bundestag AfD | 3% | Percentage | 2017 |
| % Votes Bundestag other parties | 1% | Percentage | 2017 |
| Employment | Value | Unit | Year |
|---|---|---|---|
| Employees | 4.047 | Number | 2019 |
| Employees male | 2.064 | Number | 2019 |
| Employees female | 1.983 | Number | 2019 |
| Employees foreigner | 354 | Number | 2019 |
| Employees male foreigner | 222 | Number | 2019 |
| Employees female foreigner | 132 | Number | 2019 |
| Unemployed | 286 | Number | 2018 |
| Unemployed foreigners | 55 | Number | 2018 |
| Unemployed severely disabled | 8 | Number | 2018 |
| Unemployed 15-20 | 10 | Number | 2018 |
| Unemployed 15-25 | 37 | Number | 2018 |
| Unemployed 55-65 | 68 | Number | 2018 |
| Unemployed long-term | 84 | Number | 2018 |
| % Unemployed | 3% | Percentage | 2018 |
| % Unemployed foreigners | 1% | Percentage of the population | 2018 |
| % Unemployed severely disabled | 0% | Percentage of the population | 2018 |
| % Unemployed 15-20 | 0% | Percentage of the population | 2018 |
| % Unemployed 15-25 | 0% | Percentage of the population | 2018 |
| % Unemployed 55-65 | 1% | Percentage of the population | 2018 |
| % Unemployed long-term | 1% | Percentage of the population | 2018 |
| Income | Value | Unit | Year |
|---|---|---|---|
| Income receivers | 4.842 | Number | 2015 |
| Income total | €166.260 | Euro | 2015 |
| Income tax | €25.410 | Euro | 2015 |
| Population | Value | Unit | Year |
|---|---|---|---|
| Population | 9.882 | Number | 2019 |
| Men | 4.768 | Number | 2019 |
| Women | 5.114 | Number | 2019 |
| % Men | 48% | Percentage | 2019 |
| % Women | 52% | Percentage | 2019 |
| 0-18 | 1.704 | Number | 2019 |
| 18-30 | 1.286 | Number | 2019 |
| 30-45 | 1.637 | Number | 2019 |
| 45-60 | 2.353 | Number | 2019 |
| 18-60 | 5.276 | Number | 2019 |
| 60-75 | 1.641 | Number | 2019 |
| 60+ | 2.902 | Number | 2019 |
| Average age | 45 | Average number | 2019 |
| Average age male | 43 | Average number | 2019 |
| Average age female | 47 | Average number | 2019 |
| Births | 89 | Number | 2018 |
| Births male | 48 | Number | 2018 |
| Births female | 41 | Number | 2018 |
| 1K Births | 9 | Number per 1000 inhabitants | 2018 |
| Deaths | 131 | Number | 2018 |
| Deaths male | 58 | Number | 2018 |
| Deaths female | 73 | Number | 2018 |
| 1K Deaths | 13 | Number | 2018 |
| 0-3 | 239 | Number | 2019 |
| Girls 0-3 | 115 | Number | 2019 |
| Boys 0-3 | 124 | Number | 2019 |
| 3-6 | 231 | Number | 2019 |
| Girls 3-6 | 103 | Number | 2019 |
| Boys 3-6 | 128 | Number | 2019 |
| 6-10 | 334 | Number | 2019 |
| 10-15 | 539 | Number | 2019 |
| 15-18 | 361 | Number | 2019 |
| 18-20 | 255 | Number | 2019 |
| 20-25 | 524 | Number | 2019 |
| 25-30 | 507 | Number | 2019 |
| 30-35 | 521 | Number | 2019 |
| 35-40 | 545 | Number | 2019 |
| 40-45 | 571 | Number | 2019 |
| 45-50 | 734 | Number | 2019 |
| 50-55 | 908 | Number | 2019 |
| 55-60 | 711 | Number | 2019 |
| 60-65 | 656 | Number | 2019 |
| 65-75 | 985 | Number | 2019 |
| Women 65-70 | 528 | Number | 2019 |
| Men 65-70 | 457 | Number | 2019 |
| 75+ | 1.261 | Number | 2019 |
| Women 75+ | 781 | Number | 2019 |
| Men 75+ | 480 | Number | 2019 |
| % 0-10 | 8% | Percentage | 2019 |
| % 10-18 | 9% | Percentage | 2019 |
| % 18-30 | 13% | Percentage | 2019 |
| % 30-45 | 17% | Percentage | 2019 |
| % 45-60 | 24% | Percentage | 2019 |
| % 60+ | 29% | Percentage | 2019 |
| Real estate | Value | Unit | Year |
|---|---|---|---|
| Property tax A revenue | €49.621 | Euro | 2018 |
| Property tax B revenue | €1.455.980 | Euro | 2018 |
| Trade tax actual revenue | €9.754.090 | Euro | 2018 |
| Property tax A basic amount | €14.177 | Euro | 2018 |
| Property tax B basic amount | €415.994 | Euro | 2018 |
| Trade tax basic amount | €2.566.866 | Euro | 2018 |
| Property tax A rate | €350 | Euro | 2018 |
| Property tax B rate | €350 | Euro | 2018 |
| Trade tax rate | €380 | Euro | 2018 |
| Real tax raising force | €12.333.266 | Euro | 2018 |
| Trade tax levy | €1.753.165 | Euro | 2018 |
| Trade tax net | €8.000.925 | Euro | 2018 |
| Community share in income tax | €3.599.009 | Euro | 2018 |
| Community share in sales tax | €881.306 | Euro | 2018 |
| Tax revenue | €15.060.416 | Euro | 2018 |
| Regional | Value | Unit | Year |
|---|---|---|---|
| Region code | 010545489088 | Code | 2019 |
| Region code 8 digits | 01054088 | Code | 01054088 |
| Sorting code | 010545489088 | Code | 010545489088 |
| Sorting code 8 digits | 01054088 | Code | 01054088 |
| Region name | Niebüll | Name | 2019 |
| Regional level | 6 | Categorical type | 2019 |
| Region type | Municipality | Categorical type | 2019 |
| Region type detail | municipality city | Categorical type | 2019 |
| Region name with type | municipality city Niebüll | Name | 2019 |
| Region name in German | Gemeinde Stadt Niebüll | Name | 2019 |
| Direct subregions | no data | Number | 2019 |
| NUTS code | DEF07 | Code | 2019 |
| Area | 31 | Area in km² | 2019 |
| Religion | Value | Unit | Year |
|---|---|---|---|
| Roman Catholic church | 567 | Number | 2011 |
| Protestant church | 5.693 | Number | 2011 |
| Other or none | 3.322 | Number | 2011 |
| % Roman Catholic church | 6% | Percentage | 2011 |
| % Protestant church | 59% | Percentage | 2011 |
| % Other or none | 35% | Percentage | 2011 |
| Roman Catholic church German | 475 | Number | 2011 |
| Protestant church German | 5.649 | Number | 2011 |
| Other or none German | 2.984 | Number | 2011 |
| % Roman Catholic church German | 5% | Percentage | 2011 |
| % Protestant church German | 62% | Percentage | 2011 |
| % Other or none German Foreign | 33% | Percentage | 2011 |
| Roman Catholic church Foreign | 92 | Number | 2011 |
| Protestant church Foreign | 44 | Number | 2011 |
| Other or none Foreign | 338 | Number | 2011 |
| % Roman Catholic church Foreign | 19% | Percentage | 2011 |
| % Protestant church Foreign | 9% | Percentage | 2011 |
| % Other or none Foreign | 71% | Percentage | 2011 |
Open data sources used
Data is used from multiple German open data providers. See this description of the sources with the definitions of all regional topics.
Sources & definitionsUnder development
Work is in progress to add more information to this page
This page will be further expanded with more topics in clear graphs. This will be done in several iterations in the coming weeks.