One moment please, your device is loading the charts...
Population numbers in the municipality Dorfchemnitz for the years 2009 thru 2019.
The number of inhabitants is the number of persons as registered in the population register on January 1st.
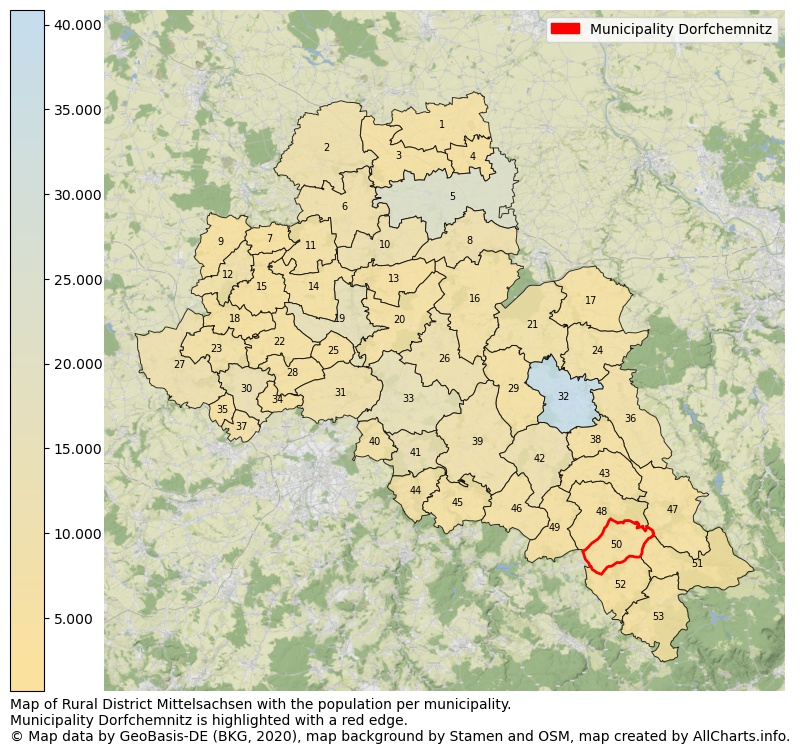
Map of Rural district Mittelsachsen with the population per municipality.Municipality Dorfchemnitz is highlighted with a red edge. The numbers at the map represent the following municipalities: 1: municipality Ostrau, 2: municipality city Leisnig, 3: municipality Großweitzschen, 4: municipality Zschaitz-Ottewig, 5: municipality city Döbeln ...Show more... Map of Rural district Mittelsachsen with the population per municipality.Municipality Dorfchemnitz is highlighted with a red edge. The numbers at the map represent the following municipalities: 1: municipality Ostrau, 2: municipality city Leisnig, 3: municipality Großweitzschen, 4: municipality Zschaitz-Ottewig, 5: municipality city Döbeln, 6: municipality city Hartha, 7: municipality Zettlitz, 8: municipality city Roßwein, 9: municipality Königsfeld, 10: municipality city Waldheim, 11: municipality city Geringswalde, 12: municipality city Rochlitz, 13: municipality Kriebstein, 14: municipality Erlau, 15: municipality Seelitz, 16: municipality Striegistal, 17: municipality Reinsberg, 18: municipality Wechselburg, 19: municipality city Mittweida, 20: municipality Rossau, 21: municipality city Großschirma, 22: municipality Königshain-Wiederau, 23: municipality city Lunzenau, 24: municipality Halsbrücke, 25: municipality Altmittweida, 26: municipality city Hainichen, 27: municipality city Penig, 28: municipality Claußnitz, 29: municipality Oberschöna, 30: municipality city Burgstädt, 31: municipality Lichtenau, 32: municipality city Freiberg, 33: municipality city Frankenberg/Sa., 34: municipality Taura, 35: municipality Mühlau, 36: municipality Bobritzsch-Hilbersdorf, 37: municipality Hartmannsdorf, 38: municipality Weißenborn/Erzgeb., 39: municipality city Oederan, 40: municipality Niederwiesa, 41: municipality city Flöha, 42: municipality city Brand-Erbisdorf, 43: municipality Lichtenberg/Erzgeb., 44: municipality city Augustusburg, 45: municipality Leubsdorf, 46: municipality Eppendorf, 47: municipality city Frauenstein, 48: municipality Mulda/Sa., 49: municipality Großhartmannsdorf, 50: municipality Dorfchemnitz, 51: municipality Rechenberg-Bienenmühle, 52: municipality city Sayda, 53: municipality Neuhausen/Erzgeb. ...Show less...
One moment please, your device is loading the charts...
Municipality Dorfchemnitz, 2019, number of rooms per house.
The percentage shows the relative share of houses per category based on the numer of rooms: 1 to 2 rooms, 3 to 4 rooms or 5 rooms or more. This is based on the total number of rooms as identified for all dwellings in the municipality Dorfchemnitz.
The table below shows data for more than 100 topics as most recently available for the municipality Dorfchemnitz. Select a category to display the related topics:
| Business | Value | Unit | Year |
|---|---|---|---|
| Businesses | 1 | Number | 2017 |
| Active persons | 0 | Number | 2017 |
| Gross wages | €0 | Euro | 2017 |
| Dwellings | Value | Unit | Year |
|---|---|---|---|
| Houses 1 room | 5 | Number | 2019 |
| Houses 2 rooms | 61 | Number | 2019 |
| Houses 3 rooms | 175 | Number | 2019 |
| Houses 4 rooms | 168 | Number | 2019 |
| Houses 5 rooms | 168 | Number | 2019 |
| Houses 6 rooms | 111 | Number | 2019 |
| Houses 7+ rooms | 97 | Number | 2019 |
| Houses 1-2 rooms | 66 | Number | 2019 |
| Houses 3-4 rooms | 343 | Number | 2019 |
| Houses 5+ rooms | 376 | Number | 2019 |
| 1-2 rooms | 8% | Percentage | 2019 |
| 3-4 rooms | 44% | Percentage | 2019 |
| 5+ rooms | 48% | Percentage | 2019 |
| Elections | Value | Unit | Year |
|---|---|---|---|
| Voters Bundestag | 1291,00 | Number | 2017 |
| Voter turnout Bundestag | 69 | Number | 2017 |
| Votes valid Bundestag | 874 | Number | 2017 |
| Votes Bundestag CDU/CSU | 246 | Number | 2017 |
| Votes Bundestag SPD | 53 | Number | 2017 |
| Votes Bundestag GRÜNE | 18 | Number | 2017 |
| Votes Bundestag FDP | 52 | Number | 2017 |
| Votes Bundestag DIE LINKE | 45 | Number | 2017 |
| Votes Bundestag AfD | 414 | Number | 2017 |
| Votes Bundestag other parties | 46 | Number | 2017 |
| Votes Bundestag total | 874 | Number | 2017 |
| % Votes Bundestag CDU/CSU | 19% | Percentage | 2017 |
| % Votes Bundestag SPD | 4% | Percentage | 2017 |
| % Votes Bundestag GRÜNE | 1% | Percentage | 2017 |
| % Votes Bundestag FDP | 4% | Percentage | 2017 |
| % Votes Bundestag DIE LINKE | 3% | Percentage | 2017 |
| % Votes Bundestag AfD | 32% | Percentage | 2017 |
| % Votes Bundestag other parties | 4% | Percentage | 2017 |
| Employment | Value | Unit | Year |
|---|---|---|---|
| Employees | 648 | Number | 2019 |
| Employees male | 329 | Number | 2019 |
| Employees female | 319 | Number | 2019 |
| Employees foreigner | 0 | Number | 2019 |
| Employees male foreigner | 0 | Number | 2019 |
| Employees female foreigner | 0 | Number | 2019 |
| Unemployed | 37 | Number | 2018 |
| Unemployed foreigners | 1 | Number | 2018 |
| Unemployed severely disabled | 5 | Number | 2018 |
| Unemployed 15-20 | 0 | Number | 2018 |
| Unemployed 15-25 | 1 | Number | 2018 |
| Unemployed 55-65 | 21 | Number | 2018 |
| Unemployed long-term | 17 | Number | 2018 |
| % Unemployed | 2% | Percentage | 2018 |
| % Unemployed foreigners | 0% | Percentage of the population | 2018 |
| % Unemployed severely disabled | 0% | Percentage of the population | 2018 |
| % Unemployed 15-20 | 0% | Percentage of the population | 2018 |
| % Unemployed 15-25 | 0% | Percentage of the population | 2018 |
| % Unemployed 55-65 | 1% | Percentage of the population | 2018 |
| % Unemployed long-term | 1% | Percentage of the population | 2018 |
| Income | Value | Unit | Year |
|---|---|---|---|
| Income receivers | 675 | Number | 2015 |
| Income total | €19.787 | Euro | 2015 |
| Income tax | €2.308 | Euro | 2015 |
| Population | Value | Unit | Year |
|---|---|---|---|
| Population | 1.551 | Number | 2019 |
| Men | 781 | Number | 2019 |
| Women | 770 | Number | 2019 |
| % Men | 50% | Percentage | 2019 |
| % Women | 50% | Percentage | 2019 |
| 0-18 | 270 | Number | 2019 |
| 18-30 | 135 | Number | 2019 |
| 30-45 | 242 | Number | 2019 |
| 45-60 | 375 | Number | 2019 |
| 18-60 | 752 | Number | 2019 |
| 60-75 | 322 | Number | 2019 |
| 60+ | 529 | Number | 2019 |
| Average age | 47 | Average number | 2019 |
| Average age male | 46 | Average number | 2019 |
| Average age female | 48 | Average number | 2019 |
| Births | 8 | Number | 2018 |
| Births male | 2 | Number | 2018 |
| Births female | 6 | Number | 2018 |
| 1K Births | 5 | Number per 1000 inhabitants | 2018 |
| Deaths | 14 | Number | 2018 |
| Deaths male | 9 | Number | 2018 |
| Deaths female | 5 | Number | 2018 |
| 1K Deaths | 9 | Number | 2018 |
| 0-3 | 42 | Number | 2019 |
| Girls 0-3 | 26 | Number | 2019 |
| Boys 0-3 | 16 | Number | 2019 |
| 3-6 | 45 | Number | 2019 |
| Girls 3-6 | 20 | Number | 2019 |
| Boys 3-6 | 25 | Number | 2019 |
| 6-10 | 67 | Number | 2019 |
| 10-15 | 81 | Number | 2019 |
| 15-18 | 35 | Number | 2019 |
| 18-20 | 28 | Number | 2019 |
| 20-25 | 35 | Number | 2019 |
| 25-30 | 72 | Number | 2019 |
| 30-35 | 67 | Number | 2019 |
| 35-40 | 98 | Number | 2019 |
| 40-45 | 77 | Number | 2019 |
| 45-50 | 113 | Number | 2019 |
| 50-55 | 131 | Number | 2019 |
| 55-60 | 131 | Number | 2019 |
| 60-65 | 134 | Number | 2019 |
| 65-75 | 188 | Number | 2019 |
| Women 65-70 | 87 | Number | 2019 |
| Men 65-70 | 101 | Number | 2019 |
| 75+ | 207 | Number | 2019 |
| Women 75+ | 121 | Number | 2019 |
| Men 75+ | 86 | Number | 2019 |
| % 0-10 | 10% | Percentage | 2019 |
| % 10-18 | 7% | Percentage | 2019 |
| % 18-30 | 9% | Percentage | 2019 |
| % 30-45 | 16% | Percentage | 2019 |
| % 45-60 | 24% | Percentage | 2019 |
| % 60+ | 34% | Percentage | 2019 |
| Real estate | Value | Unit | Year |
|---|---|---|---|
| Property tax A revenue | no data | Euro | no data |
| Property tax B revenue | no data | Euro | no data |
| Trade tax actual revenue | no data | Euro | no data |
| Property tax A basic amount | no data | Euro | no data |
| Property tax B basic amount | no data | Euro | no data |
| Trade tax basic amount | no data | Euro | no data |
| Property tax A rate | no data | Euro | no data |
| Property tax B rate | no data | Euro | no data |
| Trade tax rate | no data | Euro | no data |
| Real tax raising force | no data | Euro | no data |
| Trade tax levy | no data | Euro | no data |
| Trade tax net | no data | Euro | no data |
| Community share in income tax | no data | Euro | no data |
| Community share in sales tax | no data | Euro | no data |
| Tax revenue | no data | Euro | no data |
| Regional | Value | Unit | Year |
|---|---|---|---|
| Region code | 145225129090 | Code | 2019 |
| Region code 8 digits | 14522090 | Code | 14522090 |
| Sorting code | 145225129090 | Code | 145225129090 |
| Sorting code 8 digits | 14522090 | Code | 14522090 |
| Region name | Dorfchemnitz | Name | 2019 |
| Regional level | 6 | Categorical type | 2019 |
| Region type | Municipality | Categorical type | 2019 |
| Region type detail | municipality | Categorical type | 2019 |
| Region name with type | municipality Dorfchemnitz | Name | 2019 |
| Region name in German | Gemeinde Dorfchemnitz | Name | 2019 |
| Direct subregions | no data | Number | 2019 |
| NUTS code | DED43 | Code | 2019 |
| Area | 30 | Area in km² | 2019 |
| Religion | Value | Unit | Year |
|---|---|---|---|
| Roman Catholic church | 24 | Number | 2011 |
| Protestant church | 1.084 | Number | 2011 |
| Other or none | 552 | Number | 2011 |
| % Roman Catholic church | 1% | Percentage | 2011 |
| % Protestant church | 65% | Percentage | 2011 |
| % Other or none | 33% | Percentage | 2011 |
| Roman Catholic church German | 21 | Number | 2011 |
| Protestant church German | 1.084 | Number | 2011 |
| Other or none German | 552 | Number | 2011 |
| % Roman Catholic church German | 1% | Percentage | 2011 |
| % Protestant church German | 65% | Percentage | 2011 |
| % Other or none German Foreign | 33% | Percentage | 2011 |
| Roman Catholic church Foreign | 3 | Number | 2011 |
| Protestant church Foreign | 0 | Number | 2011 |
| Other or none Foreign | 0 | Number | 2011 |
| % Roman Catholic church Foreign | 100% | Percentage | 2011 |
| % Protestant church Foreign | 0% | Percentage | 2011 |
| % Other or none Foreign | 0% | Percentage | 2011 |
Data is used from multiple German open data providers. See this description of the sources with the definitions of all regional topics.
Sources & definitionsThis page will be further expanded with more topics in clear graphs. This will be done in several iterations in the coming weeks.
![]()
© Published:
 Contents and more information: