Population numbers per year
The number of inhabitants in the municipality Ensheim
One moment please, your device is loading the charts...
Population numbers in the municipality Ensheim for the years 2009 thru 2019.
The number of inhabitants is the number of persons as registered in the population register on January 1st.
Population at the map of Ensheim
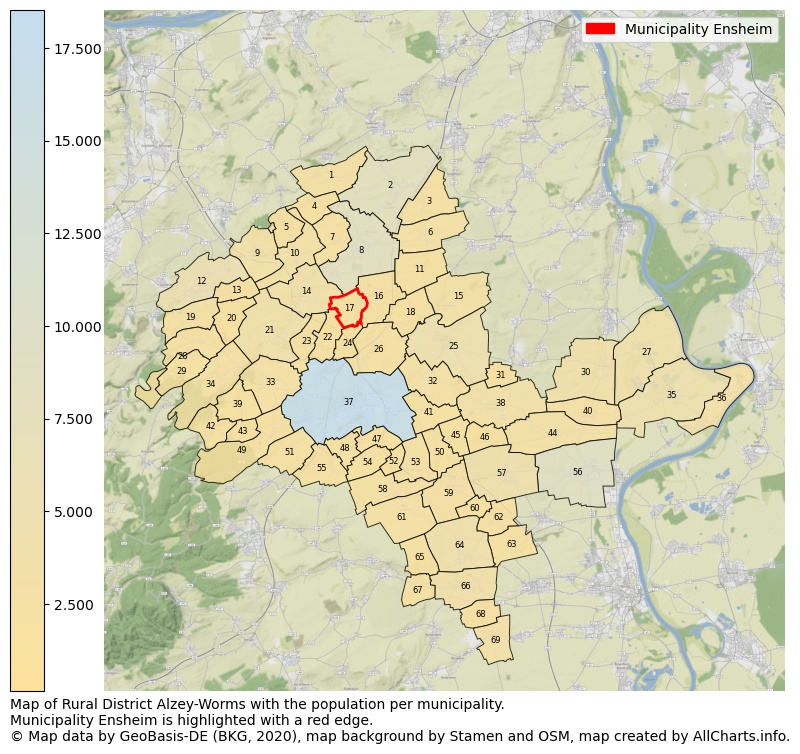
Map of Rural district Alzey-Worms with the population per municipality.Municipality Ensheim is highlighted with a red edge. The numbers at the map represent the following municipalities: 1: municipality Partenheim, 2: municipality Saulheim, 3: municipality Udenheim, 4: municipality Vendersheim, 5: municipality Gau-Weinheim ...Show more... Map of Rural district Alzey-Worms with the population per municipality.Municipality Ensheim is highlighted with a red edge. The numbers at the map represent the following municipalities: 1: municipality Partenheim, 2: municipality Saulheim, 3: municipality Udenheim, 4: municipality Vendersheim, 5: municipality Gau-Weinheim, 6: municipality Schornsheim, 7: municipality Sulzheim, 8: municipality city Wörrstadt, 9: municipality Gau-Bickelheim, 10: municipality Wallertheim, 11: municipality Gabsheim, 12: municipality Wöllstein, 13: municipality Gumbsheim, 14: municipality Armsheim, 15: municipality Bechtolsheim, 16: municipality Spiesheim, 17: municipality Ensheim, 18: municipality Biebelnheim, 19: municipality Siefersheim, 20: municipality Eckelsheim, 21: municipality Flonheim, 22: municipality Lonsheim, 23: municipality Bornheim, 24: municipality Bermersheim vor der Höhe, 25: municipality Gau-Odernheim, 26: municipality Albig, 27: municipality Gimbsheim, 28: municipality Wonsheim, 29: municipality Stein-Bockenheim, 30: municipality Alsheim, 31: municipality Frettenheim, 32: municipality Framersheim, 33: municipality Erbes-Büdesheim, 34: municipality Wendelsheim, 35: municipality Eich, 36: municipality Hamm am Rhein, 37: municipality city Alzey, 38: municipality Dittelsheim-Heßloch, 39: municipality Nack, 40: municipality Mettenheim, 41: municipality Gau-Heppenheim, 42: municipality Nieder-Wiesen, 43: municipality Bechenheim, 44: municipality Bechtheim, 45: municipality Hochborn, 46: municipality Monzernheim, 47: municipality Kettenheim, 48: municipality Wahlheim, 49: municipality Offenheim, 50: municipality Hangen-Weisheim, 51: municipality Mauchenheim, 52: municipality Dintesheim, 53: municipality Eppelsheim, 54: municipality Esselborn, 55: municipality Freimersheim, 56: municipality city Osthofen, 57: municipality Westhofen, 58: municipality Flomborn, 59: municipality Gundersheim, 60: municipality Bermersheim, 61: municipality Ober-Flörsheim, 62: municipality Gundheim, 63: municipality Mörstadt, 64: municipality Flörsheim-Dalsheim, 65: municipality Mölsheim, 66: municipality Monsheim, 67: municipality Wachenheim, 68: municipality Hohen-Sülzen, 69: municipality Offstein ...Show less...
The number of rooms per house (dwelling)
The number of rooms of the houses in the municipality Ensheim
One moment please, your device is loading the charts...
Municipality Ensheim, 2019, number of rooms per house.
The percentage shows the relative share of houses per category based on the numer of rooms: 1 to 2 rooms, 3 to 4 rooms or 5 rooms or more. This is based on the total number of rooms as identified for all dwellings in the municipality Ensheim.
Data about more than 100 topics!
The table below shows data for more than 100 topics as most recently available for the municipality Ensheim. Select a category to display the related topics:
| Business | Value | Unit | Year |
|---|---|---|---|
| Businesses | no data | Number | 2015 |
| Active persons | no data | Number | 2015 |
| Gross wages | no data | Euro | 2015 |
| Dwellings | Value | Unit | Year |
|---|---|---|---|
| Houses 1 room | 4 | Number | 2019 |
| Houses 2 rooms | 2 | Number | 2019 |
| Houses 3 rooms | 6 | Number | 2019 |
| Houses 4 rooms | 28 | Number | 2019 |
| Houses 5 rooms | 58 | Number | 2019 |
| Houses 6 rooms | 47 | Number | 2019 |
| Houses 7+ rooms | 67 | Number | 2019 |
| Houses 1-2 rooms | 6 | Number | 2019 |
| Houses 3-4 rooms | 34 | Number | 2019 |
| Houses 5+ rooms | 172 | Number | 2019 |
| 1-2 rooms | 3% | Percentage | 2019 |
| 3-4 rooms | 16% | Percentage | 2019 |
| 5+ rooms | 81% | Percentage | 2019 |
| Elections | Value | Unit | Year |
|---|---|---|---|
| Voters Bundestag | 374,00 | Number | 2017 |
| Voter turnout Bundestag | 85 | Number | 2017 |
| Votes valid Bundestag | 228 | Number | 2017 |
| Votes Bundestag CDU/CSU | 69 | Number | 2017 |
| Votes Bundestag SPD | 50 | Number | 2017 |
| Votes Bundestag GRÜNE | 19 | Number | 2017 |
| Votes Bundestag FDP | 33 | Number | 2017 |
| Votes Bundestag DIE LINKE | 19 | Number | 2017 |
| Votes Bundestag AfD | 31 | Number | 2017 |
| Votes Bundestag other parties | 7 | Number | 2017 |
| Votes Bundestag total | 228 | Number | 2017 |
| % Votes Bundestag CDU/CSU | 18% | Percentage | 2017 |
| % Votes Bundestag SPD | 13% | Percentage | 2017 |
| % Votes Bundestag GRÜNE | 5% | Percentage | 2017 |
| % Votes Bundestag FDP | 9% | Percentage | 2017 |
| % Votes Bundestag DIE LINKE | 5% | Percentage | 2017 |
| % Votes Bundestag AfD | 8% | Percentage | 2017 |
| % Votes Bundestag other parties | 2% | Percentage | 2017 |
| Employment | Value | Unit | Year |
|---|---|---|---|
| Employees | 198 | Number | 2019 |
| Employees male | 103 | Number | 2019 |
| Employees female | 95 | Number | 2019 |
| Employees foreigner | 22 | Number | 2019 |
| Employees male foreigner | 0 | Number | 2019 |
| Employees female foreigner | 0 | Number | 2019 |
| Unemployed | 8 | Number | 2018 |
| Unemployed foreigners | 0 | Number | 2018 |
| Unemployed severely disabled | 0 | Number | 2018 |
| Unemployed 15-20 | 0 | Number | 2018 |
| Unemployed 15-25 | 1 | Number | 2018 |
| Unemployed 55-65 | 1 | Number | 2018 |
| Unemployed long-term | 3 | Number | 2018 |
| % Unemployed | 2% | Percentage | 2018 |
| % Unemployed foreigners | 0% | Percentage of the population | 2018 |
| % Unemployed severely disabled | 0% | Percentage of the population | 2018 |
| % Unemployed 15-20 | 0% | Percentage of the population | 2018 |
| % Unemployed 15-25 | 0% | Percentage of the population | 2018 |
| % Unemployed 55-65 | 0% | Percentage of the population | 2018 |
| % Unemployed long-term | 1% | Percentage of the population | 2018 |
| Income | Value | Unit | Year |
|---|---|---|---|
| Income receivers | 228 | Number | 2015 |
| Income total | €11.596 | Euro | 2015 |
| Income tax | €2.122 | Euro | 2015 |
| Population | Value | Unit | Year |
|---|---|---|---|
| Population | 464 | Number | 2019 |
| Men | 237 | Number | 2019 |
| Women | 227 | Number | 2019 |
| % Men | 51% | Percentage | 2019 |
| % Women | 49% | Percentage | 2019 |
| 0-18 | 80 | Number | 2019 |
| 18-30 | 57 | Number | 2019 |
| 30-45 | 77 | Number | 2019 |
| 45-60 | 127 | Number | 2019 |
| 18-60 | 261 | Number | 2019 |
| 60-75 | 79 | Number | 2019 |
| 60+ | 123 | Number | 2019 |
| Average age | 44 | Average number | 2019 |
| Average age male | 42 | Average number | 2019 |
| Average age female | 47 | Average number | 2019 |
| Births | 7 | Number | 2018 |
| Births male | 7 | Number | 2018 |
| Births female | 0 | Number | 2018 |
| 1K Births | 15 | Number per 1000 inhabitants | 2018 |
| Deaths | 7 | Number | 2018 |
| Deaths male | 3 | Number | 2018 |
| Deaths female | 4 | Number | 2018 |
| 1K Deaths | 15 | Number | 2018 |
| 0-3 | 12 | Number | 2019 |
| Girls 0-3 | 3 | Number | 2019 |
| Boys 0-3 | 9 | Number | 2019 |
| 3-6 | 14 | Number | 2019 |
| Girls 3-6 | 6 | Number | 2019 |
| Boys 3-6 | 8 | Number | 2019 |
| 6-10 | 16 | Number | 2019 |
| 10-15 | 20 | Number | 2019 |
| 15-18 | 18 | Number | 2019 |
| 18-20 | 11 | Number | 2019 |
| 20-25 | 26 | Number | 2019 |
| 25-30 | 20 | Number | 2019 |
| 30-35 | 16 | Number | 2019 |
| 35-40 | 27 | Number | 2019 |
| 40-45 | 34 | Number | 2019 |
| 45-50 | 33 | Number | 2019 |
| 50-55 | 49 | Number | 2019 |
| 55-60 | 45 | Number | 2019 |
| 60-65 | 32 | Number | 2019 |
| 65-75 | 47 | Number | 2019 |
| Women 65-70 | 22 | Number | 2019 |
| Men 65-70 | 25 | Number | 2019 |
| 75+ | 44 | Number | 2019 |
| Women 75+ | 26 | Number | 2019 |
| Men 75+ | 18 | Number | 2019 |
| % 0-10 | 9% | Percentage | 2019 |
| % 10-18 | 8% | Percentage | 2019 |
| % 18-30 | 12% | Percentage | 2019 |
| % 30-45 | 17% | Percentage | 2019 |
| % 45-60 | 27% | Percentage | 2019 |
| % 60+ | 27% | Percentage | 2019 |
| Real estate | Value | Unit | Year |
|---|---|---|---|
| Property tax A revenue | €11.586 | Euro | 2018 |
| Property tax B revenue | no data | Euro | no data |
| Trade tax actual revenue | no data | Euro | no data |
| Property tax A basic amount | no data | Euro | no data |
| Property tax B basic amount | no data | Euro | no data |
| Trade tax basic amount | €1.200 | Euro | 2018 |
| Property tax A rate | €335 | Euro | 2018 |
| Property tax B rate | no data | Euro | no data |
| Trade tax rate | no data | Euro | no data |
| Real tax raising force | no data | Euro | no data |
| Trade tax levy | €820 | Euro | 2018 |
| Trade tax net | €3.801 | Euro | 2018 |
| Community share in income tax | no data | Euro | no data |
| Community share in sales tax | no data | Euro | no data |
| Tax revenue | no data | Euro | no data |
| Regional | Value | Unit | Year |
|---|---|---|---|
| Region code | 073315006019 | Code | 2019 |
| Region code 8 digits | 07331019 | Code | 07331019 |
| Sorting code | 073315006019 | Code | 073315006019 |
| Sorting code 8 digits | 07331019 | Code | 07331019 |
| Region name | Ensheim | Name | 2019 |
| Regional level | 6 | Categorical type | 2019 |
| Region type | Municipality | Categorical type | 2019 |
| Region type detail | municipality | Categorical type | 2019 |
| Region name with type | municipality Ensheim | Name | 2019 |
| Region name in German | Gemeinde Ensheim | Name | 2019 |
| Direct subregions | no data | Number | 2019 |
| NUTS code | DEB3B | Code | 2019 |
| Area | 4 | Area in km² | 2019 |
| Religion | Value | Unit | Year |
|---|---|---|---|
| Roman Catholic church | 78 | Number | 2011 |
| Protestant church | 225 | Number | 2011 |
| Other or none | 135 | Number | 2011 |
| % Roman Catholic church | 18% | Percentage | 2011 |
| % Protestant church | 51% | Percentage | 2011 |
| % Other or none | 31% | Percentage | 2011 |
| Roman Catholic church German | 75 | Number | 2011 |
| Protestant church German | 225 | Number | 2011 |
| Other or none German | 120 | Number | 2011 |
| % Roman Catholic church German | 18% | Percentage | 2011 |
| % Protestant church German | 54% | Percentage | 2011 |
| % Other or none German Foreign | 29% | Percentage | 2011 |
| Roman Catholic church Foreign | 3 | Number | 2011 |
| Protestant church Foreign | 0 | Number | 2011 |
| Other or none Foreign | 15 | Number | 2011 |
| % Roman Catholic church Foreign | 17% | Percentage | 2011 |
| % Protestant church Foreign | 0% | Percentage | 2011 |
| % Other or none Foreign | 83% | Percentage | 2011 |
Open data sources used
Data is used from multiple German open data providers. See this description of the sources with the definitions of all regional topics.
Sources & definitionsUnder development
Work is in progress to add more information to this page
This page will be further expanded with more topics in clear graphs. This will be done in several iterations in the coming weeks.