One moment please, your device is loading the charts...
Population numbers in the municipality Frankenheim/Rhön for the years 2009 thru 2019.
The number of inhabitants is the number of persons as registered in the population register on January 1st.
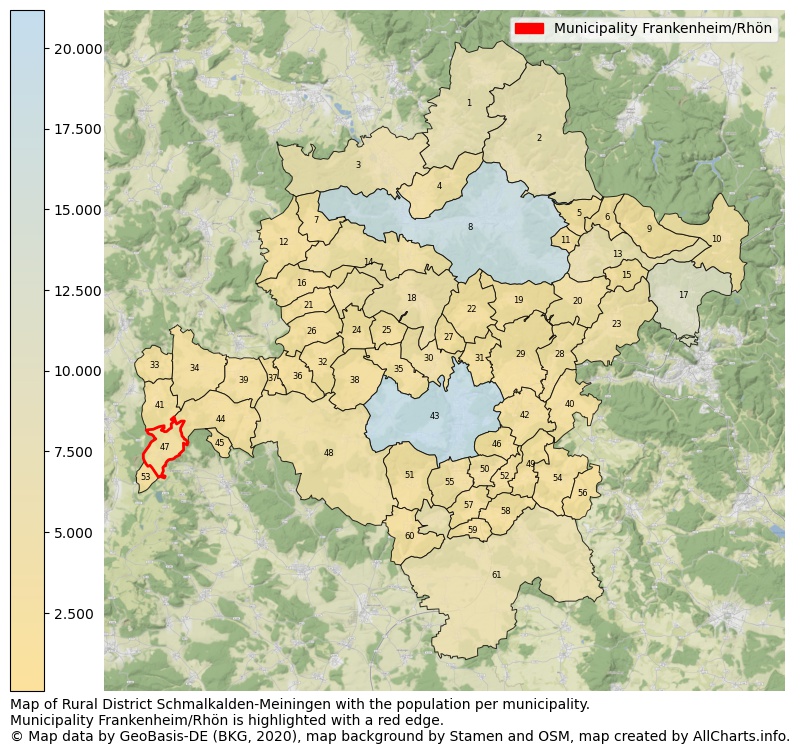
Map of Rural district Schmalkalden-Meiningen with the population per municipality.Municipality Frankenheim/Rhön is highlighted with a red edge. The numbers at the map represent the following municipalities: 1: municipality city Brotterode-Trusetal, 2: municipality Floh-Seligenthal, 3: municipality Breitungen/Werra, 4: municipality Fambach, 5: municipality Rotterode ...Show more... Map of Rural district Schmalkalden-Meiningen with the population per municipality.Municipality Frankenheim/Rhön is highlighted with a red edge. The numbers at the map represent the following municipalities: 1: municipality city Brotterode-Trusetal, 2: municipality Floh-Seligenthal, 3: municipality Breitungen/Werra, 4: municipality Fambach, 5: municipality Rotterode, 6: municipality Unterschönau, 7: municipality Rosa, 8: municipality city Schmalkalden, 9: municipality Oberschönau, 10: municipality city Oberhof, 11: municipality Altersbach, 12: municipality Roßdorf, 13: municipality city Steinbach-Hallenberg, 14: municipality Schwallungen, 15: municipality Bermbach, 16: municipality Hümpfershausen, 17: municipality city Zella-Mehlis, 18: municipality city Wasungen, 19: municipality Christes, 20: municipality Viernau, 21: municipality Friedelshausen, 22: municipality Metzels, 23: municipality Benshausen, 24: municipality Wahns, 25: municipality Mehmels, 26: municipality Oepfershausen, 27: municipality Wallbach, 28: municipality Schwarza, 29: municipality Kühndorf, 30: municipality Walldorf, 31: municipality Utendorf, 32: municipality Unterkatz, 33: municipality Unterweid, 34: municipality Kaltenwestheim, 35: municipality Rippershausen, 36: municipality Oberkatz, 37: municipality Aschenhausen, 38: municipality Stepfershausen, 39: municipality Kaltensundheim, 40: municipality Dillstädt, 41: municipality Oberweid, 42: municipality Rohr, 43: municipality city Meiningen, 44: municipality Erbenhausen, 45: municipality Melpers, 46: municipality Ellingshausen, 47: municipality Frankenheim/Rhön, 48: municipality Rhönblick, 49: municipality Belrieth, 50: municipality Obermaßfeld-Grimmenthal, 51: municipality Sülzfeld, 52: municipality Einhausen, 53: municipality Birx, 54: municipality Vachdorf, 55: municipality Untermaßfeld, 56: municipality Leutersdorf, 57: municipality Ritschenhausen, 58: municipality Neubrunn, 59: municipality Wölfershausen, 60: municipality Henneberg, 61: municipality Grabfeld ...Show less...
One moment please, your device is loading the charts...
Municipality Frankenheim/Rhön, 2019, number of rooms per house.
The percentage shows the relative share of houses per category based on the numer of rooms: 1 to 2 rooms, 3 to 4 rooms or 5 rooms or more. This is based on the total number of rooms as identified for all dwellings in the municipality Frankenheim/Rhön.
The table below shows data for more than 100 topics as most recently available for the municipality Frankenheim/Rhön. Select a category to display the related topics:
| Business | Value | Unit | Year |
|---|---|---|---|
| Businesses | 1 | Number | 2017 |
| Active persons | 0 | Number | 2017 |
| Gross wages | €0 | Euro | 2017 |
| Dwellings | Value | Unit | Year |
|---|---|---|---|
| Houses 1 room | 1 | Number | 2019 |
| Houses 2 rooms | 14 | Number | 2019 |
| Houses 3 rooms | 66 | Number | 2019 |
| Houses 4 rooms | 113 | Number | 2019 |
| Houses 5 rooms | 97 | Number | 2019 |
| Houses 6 rooms | 113 | Number | 2019 |
| Houses 7+ rooms | 102 | Number | 2019 |
| Houses 1-2 rooms | 15 | Number | 2019 |
| Houses 3-4 rooms | 179 | Number | 2019 |
| Houses 5+ rooms | 312 | Number | 2019 |
| 1-2 rooms | 3% | Percentage | 2019 |
| 3-4 rooms | 35% | Percentage | 2019 |
| 5+ rooms | 62% | Percentage | 2019 |
| Elections | Value | Unit | Year |
|---|---|---|---|
| Voters Bundestag | 921,00 | Number | 2017 |
| Voter turnout Bundestag | 53 | Number | 2017 |
| Votes valid Bundestag | 482 | Number | 2017 |
| Votes Bundestag CDU/CSU | 151 | Number | 2017 |
| Votes Bundestag SPD | 85 | Number | 2017 |
| Votes Bundestag GRÜNE | 7 | Number | 2017 |
| Votes Bundestag FDP | 35 | Number | 2017 |
| Votes Bundestag DIE LINKE | 67 | Number | 2017 |
| Votes Bundestag AfD | 124 | Number | 2017 |
| Votes Bundestag other parties | 13 | Number | 2017 |
| Votes Bundestag total | 482 | Number | 2017 |
| % Votes Bundestag CDU/CSU | 16% | Percentage | 2017 |
| % Votes Bundestag SPD | 9% | Percentage | 2017 |
| % Votes Bundestag GRÜNE | 1% | Percentage | 2017 |
| % Votes Bundestag FDP | 4% | Percentage | 2017 |
| % Votes Bundestag DIE LINKE | 7% | Percentage | 2017 |
| % Votes Bundestag AfD | 13% | Percentage | 2017 |
| % Votes Bundestag other parties | 1% | Percentage | 2017 |
| Employment | Value | Unit | Year |
|---|---|---|---|
| Employees | 489 | Number | 2019 |
| Employees male | 292 | Number | 2019 |
| Employees female | 197 | Number | 2019 |
| Employees foreigner | 0 | Number | 2019 |
| Employees male foreigner | 0 | Number | 2019 |
| Employees female foreigner | 0 | Number | 2019 |
| Unemployed | 24 | Number | 2018 |
| Unemployed foreigners | 0 | Number | 2018 |
| Unemployed severely disabled | 3 | Number | 2018 |
| Unemployed 15-20 | 0 | Number | 2018 |
| Unemployed 15-25 | 0 | Number | 2018 |
| Unemployed 55-65 | 6 | Number | 2018 |
| Unemployed long-term | 11 | Number | 2018 |
| % Unemployed | 2% | Percentage | 2018 |
| % Unemployed foreigners | 0% | Percentage of the population | 2018 |
| % Unemployed severely disabled | 0% | Percentage of the population | 2018 |
| % Unemployed 15-20 | 0% | Percentage of the population | 2018 |
| % Unemployed 15-25 | 0% | Percentage of the population | 2018 |
| % Unemployed 55-65 | 1% | Percentage of the population | 2018 |
| % Unemployed long-term | 1% | Percentage of the population | 2018 |
| Income | Value | Unit | Year |
|---|---|---|---|
| Income receivers | 482 | Number | 2015 |
| Income total | €13.587 | Euro | 2015 |
| Income tax | €1.687 | Euro | 2015 |
| Population | Value | Unit | Year |
|---|---|---|---|
| Population | 1.085 | Number | 2019 |
| Men | 554 | Number | 2019 |
| Women | 531 | Number | 2019 |
| % Men | 51% | Percentage | 2019 |
| % Women | 49% | Percentage | 2019 |
| 0-18 | 190 | Number | 2019 |
| 18-30 | 96 | Number | 2019 |
| 30-45 | 211 | Number | 2019 |
| 45-60 | 274 | Number | 2019 |
| 18-60 | 581 | Number | 2019 |
| 60-75 | 220 | Number | 2019 |
| 60+ | 314 | Number | 2019 |
| Average age | 45 | Average number | 2019 |
| Average age male | 44 | Average number | 2019 |
| Average age female | 46 | Average number | 2019 |
| Births | 14 | Number | 2018 |
| Births male | 7 | Number | 2018 |
| Births female | 7 | Number | 2018 |
| 1K Births | 13 | Number per 1000 inhabitants | 2018 |
| Deaths | 14 | Number | 2018 |
| Deaths male | 7 | Number | 2018 |
| Deaths female | 7 | Number | 2018 |
| 1K Deaths | 13 | Number | 2018 |
| 0-3 | 28 | Number | 2019 |
| Girls 0-3 | 15 | Number | 2019 |
| Boys 0-3 | 13 | Number | 2019 |
| 3-6 | 37 | Number | 2019 |
| Girls 3-6 | 20 | Number | 2019 |
| Boys 3-6 | 17 | Number | 2019 |
| 6-10 | 37 | Number | 2019 |
| 10-15 | 55 | Number | 2019 |
| 15-18 | 33 | Number | 2019 |
| 18-20 | 15 | Number | 2019 |
| 20-25 | 35 | Number | 2019 |
| 25-30 | 46 | Number | 2019 |
| 30-35 | 78 | Number | 2019 |
| 35-40 | 74 | Number | 2019 |
| 40-45 | 59 | Number | 2019 |
| 45-50 | 87 | Number | 2019 |
| 50-55 | 89 | Number | 2019 |
| 55-60 | 98 | Number | 2019 |
| 60-65 | 95 | Number | 2019 |
| 65-75 | 125 | Number | 2019 |
| Women 65-70 | 66 | Number | 2019 |
| Men 65-70 | 59 | Number | 2019 |
| 75+ | 94 | Number | 2019 |
| Women 75+ | 62 | Number | 2019 |
| Men 75+ | 32 | Number | 2019 |
| % 0-10 | 9% | Percentage | 2019 |
| % 10-18 | 8% | Percentage | 2019 |
| % 18-30 | 9% | Percentage | 2019 |
| % 30-45 | 19% | Percentage | 2019 |
| % 45-60 | 25% | Percentage | 2019 |
| % 60+ | 29% | Percentage | 2019 |
| Real estate | Value | Unit | Year |
|---|---|---|---|
| Property tax A revenue | no data | Euro | no data |
| Property tax B revenue | no data | Euro | no data |
| Trade tax actual revenue | no data | Euro | no data |
| Property tax A basic amount | no data | Euro | no data |
| Property tax B basic amount | no data | Euro | no data |
| Trade tax basic amount | no data | Euro | no data |
| Property tax A rate | no data | Euro | no data |
| Property tax B rate | no data | Euro | no data |
| Trade tax rate | no data | Euro | no data |
| Real tax raising force | no data | Euro | no data |
| Trade tax levy | no data | Euro | no data |
| Trade tax net | no data | Euro | no data |
| Community share in income tax | no data | Euro | no data |
| Community share in sales tax | no data | Euro | no data |
| Tax revenue | no data | Euro | no data |
| Regional | Value | Unit | Year |
|---|---|---|---|
| Region code | 160665005024 | Code | 2019 |
| Region code 8 digits | 16066024 | Code | 16066024 |
| Sorting code | 160665005024 | Code | 160665005024 |
| Sorting code 8 digits | 16066024 | Code | 16066024 |
| Region name | Frankenheim/Rhön | Name | 2019 |
| Regional level | 6 | Categorical type | 2019 |
| Region type | Municipality | Categorical type | 2019 |
| Region type detail | municipality | Categorical type | 2019 |
| Region name with type | municipality Frankenheim/Rhön | Name | 2019 |
| Region name in German | Gemeinde Frankenheim/Rhön | Name | 2019 |
| Direct subregions | no data | Number | 2019 |
| NUTS code | DEG0B | Code | 2019 |
| Area | 9 | Area in km² | 2019 |
| Religion | Value | Unit | Year |
|---|---|---|---|
| Roman Catholic church | 18 | Number | 2011 |
| Protestant church | 565 | Number | 2011 |
| Other or none | 602 | Number | 2011 |
| % Roman Catholic church | 2% | Percentage | 2011 |
| % Protestant church | 48% | Percentage | 2011 |
| % Other or none | 51% | Percentage | 2011 |
| Roman Catholic church German | 18 | Number | 2011 |
| Protestant church German | 565 | Number | 2011 |
| Other or none German | 602 | Number | 2011 |
| % Roman Catholic church German | 2% | Percentage | 2011 |
| % Protestant church German | 48% | Percentage | 2011 |
| % Other or none German Foreign | 51% | Percentage | 2011 |
| Roman Catholic church Foreign | 0 | Number | 2011 |
| Protestant church Foreign | 0 | Number | 2011 |
| Other or none Foreign | 0 | Number | 2011 |
| % Roman Catholic church Foreign | no data | Percentage | no data |
| % Protestant church Foreign | no data | Percentage | no data |
| % Other or none Foreign | no data | Percentage | no data |
Data is used from multiple German open data providers. See this description of the sources with the definitions of all regional topics.
Sources & definitionsThis page will be further expanded with more topics in clear graphs. This will be done in several iterations in the coming weeks.
![]()
© Published:
 Contents and more information: