One moment please, your device is loading the charts...
Population numbers in the municipality Garmisch-Partenkirchen for the years 2009 thru 2019.
The number of inhabitants is the number of persons as registered in the population register on January 1st.
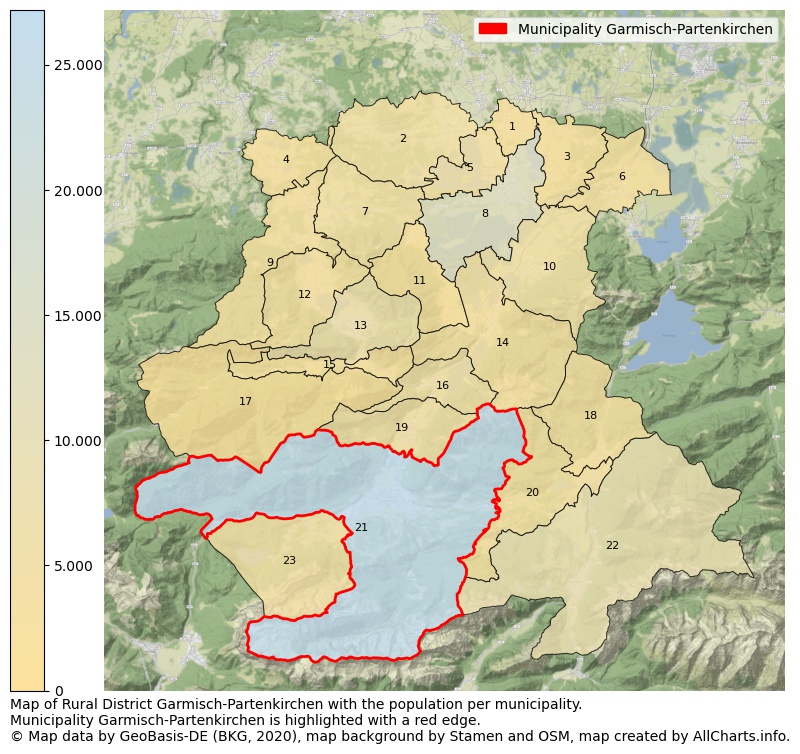
Map of Rural district Garmisch-Partenkirchen with the population per municipality.Municipality Garmisch-Partenkirchen is highlighted with a red edge. The numbers at the map represent the following municipalities: 1: municipality Spatzenhausen, 2: municipality Uffing a. Staffelsee, 3: municipality Riegsee, 4: municipality Bad Bayersoien, 5: municipality Seehausen a. Staffelsee ...Show more... Map of Rural district Garmisch-Partenkirchen with the population per municipality.Municipality Garmisch-Partenkirchen is highlighted with a red edge. The numbers at the map represent the following municipalities: 1: municipality Spatzenhausen, 2: municipality Uffing a. Staffelsee, 3: municipality Riegsee, 4: municipality Bad Bayersoien, 5: municipality Seehausen a. Staffelsee, 6: municipality Großweil, 7: municipality Bad Kohlgrub, 8: municipality Murnau a. Staffelsee, 9: municipality Saulgrub, 10: municipality Ohlstadt, 11: municipality Schwaigen, 12: municipality Unterammergau, 13: municipality Oberammergau, 14: municipality Eschenlohe, 15: municipality Ettal, 16: municipality Oberau, 17: unincorporated area Ettaler Forst, 18: municipality Wallgau, 19: municipality Farchant, 20: municipality Krün, 21: municipality Garmisch-Partenkirchen, 22: municipality Mittenwald, 23: municipality Grainau ...Show less...
One moment please, your device is loading the charts...
Municipality Garmisch-Partenkirchen, 2019, number of rooms per house.
The percentage shows the relative share of houses per category based on the numer of rooms: 1 to 2 rooms, 3 to 4 rooms or 5 rooms or more. This is based on the total number of rooms as identified for all dwellings in the municipality Garmisch-Partenkirchen.
The table below shows data for more than 100 topics as most recently available for the municipality Garmisch-Partenkirchen. Select a category to display the related topics:
| Business | Value | Unit | Year |
|---|---|---|---|
| Businesses | 3 | Number | 2017 |
| Active persons | 334 | Number | 2017 |
| Gross wages | €12.619 | Euro | 2017 |
| Dwellings | Value | Unit | Year |
|---|---|---|---|
| Houses 1 room | 1.104 | Number | 2019 |
| Houses 2 rooms | 2.447 | Number | 2019 |
| Houses 3 rooms | 4.694 | Number | 2019 |
| Houses 4 rooms | 4.038 | Number | 2019 |
| Houses 5 rooms | 1.752 | Number | 2019 |
| Houses 6 rooms | 840 | Number | 2019 |
| Houses 7+ rooms | 917 | Number | 2019 |
| Houses 1-2 rooms | 3.551 | Number | 2019 |
| Houses 3-4 rooms | 8.732 | Number | 2019 |
| Houses 5+ rooms | 3.509 | Number | 2019 |
| 1-2 rooms | 22% | Percentage | 2019 |
| 3-4 rooms | 55% | Percentage | 2019 |
| 5+ rooms | 22% | Percentage | 2019 |
| Elections | Value | Unit | Year |
|---|---|---|---|
| Voters Bundestag | 19363,00 | Number | 2017 |
| Voter turnout Bundestag | 78 | Number | 2017 |
| Votes valid Bundestag | 14.957 | Number | 2017 |
| Votes Bundestag CDU/CSU | 6.672 | Number | 2017 |
| Votes Bundestag SPD | 1.313 | Number | 2017 |
| Votes Bundestag GRÜNE | 1.110 | Number | 2017 |
| Votes Bundestag FDP | 2.047 | Number | 2017 |
| Votes Bundestag DIE LINKE | 659 | Number | 2017 |
| Votes Bundestag AfD | 2.244 | Number | 2017 |
| Votes Bundestag other parties | 912 | Number | 2017 |
| Votes Bundestag total | 14.957 | Number | 2017 |
| % Votes Bundestag CDU/CSU | 34% | Percentage | 2017 |
| % Votes Bundestag SPD | 7% | Percentage | 2017 |
| % Votes Bundestag GRÜNE | 6% | Percentage | 2017 |
| % Votes Bundestag FDP | 11% | Percentage | 2017 |
| % Votes Bundestag DIE LINKE | 3% | Percentage | 2017 |
| % Votes Bundestag AfD | 12% | Percentage | 2017 |
| % Votes Bundestag other parties | 5% | Percentage | 2017 |
| Employment | Value | Unit | Year |
|---|---|---|---|
| Employees | 10.249 | Number | 2019 |
| Employees male | 5.007 | Number | 2019 |
| Employees female | 5.242 | Number | 2019 |
| Employees foreigner | 2.350 | Number | 2019 |
| Employees male foreigner | 1.315 | Number | 2019 |
| Employees female foreigner | 1.035 | Number | 2019 |
| Unemployed | 496 | Number | 2018 |
| Unemployed foreigners | 182 | Number | 2018 |
| Unemployed severely disabled | 28 | Number | 2018 |
| Unemployed 15-20 | 14 | Number | 2018 |
| Unemployed 15-25 | 54 | Number | 2018 |
| Unemployed 55-65 | 117 | Number | 2018 |
| Unemployed long-term | 110 | Number | 2018 |
| % Unemployed | 2% | Percentage | 2018 |
| % Unemployed foreigners | 1% | Percentage of the population | 2018 |
| % Unemployed severely disabled | 0% | Percentage of the population | 2018 |
| % Unemployed 15-20 | 0% | Percentage of the population | 2018 |
| % Unemployed 15-25 | 0% | Percentage of the population | 2018 |
| % Unemployed 55-65 | 0% | Percentage of the population | 2018 |
| % Unemployed long-term | 0% | Percentage of the population | 2018 |
| Income | Value | Unit | Year |
|---|---|---|---|
| Income receivers | 14.281 | Number | 2015 |
| Income total | €548.933 | Euro | 2015 |
| Income tax | €98.488 | Euro | 2015 |
| Population | Value | Unit | Year |
|---|---|---|---|
| Population | 27.194 | Number | 2019 |
| Men | 12.956 | Number | 2019 |
| Women | 14.238 | Number | 2019 |
| % Men | 48% | Percentage | 2019 |
| % Women | 52% | Percentage | 2019 |
| 0-18 | 3.873 | Number | 2019 |
| 18-30 | 3.510 | Number | 2019 |
| 30-45 | 4.519 | Number | 2019 |
| 45-60 | 6.028 | Number | 2019 |
| 18-60 | 14.057 | Number | 2019 |
| 60-75 | 4.924 | Number | 2019 |
| 60+ | 9.264 | Number | 2019 |
| Average age | 48 | Average number | 2019 |
| Average age male | 45 | Average number | 2019 |
| Average age female | 50 | Average number | 2019 |
| Births | 253 | Number | 2018 |
| Births male | 136 | Number | 2018 |
| Births female | 117 | Number | 2018 |
| 1K Births | 9 | Number per 1000 inhabitants | 2018 |
| Deaths | 374 | Number | 2018 |
| Deaths male | 166 | Number | 2018 |
| Deaths female | 208 | Number | 2018 |
| 1K Deaths | 14 | Number | 2018 |
| 0-3 | 755 | Number | 2019 |
| Girls 0-3 | 365 | Number | 2019 |
| Boys 0-3 | 390 | Number | 2019 |
| 3-6 | 662 | Number | 2019 |
| Girls 3-6 | 318 | Number | 2019 |
| Boys 3-6 | 344 | Number | 2019 |
| 6-10 | 803 | Number | 2019 |
| 10-15 | 1.016 | Number | 2019 |
| 15-18 | 637 | Number | 2019 |
| 18-20 | 502 | Number | 2019 |
| 20-25 | 1.401 | Number | 2019 |
| 25-30 | 1.607 | Number | 2019 |
| 30-35 | 1.577 | Number | 2019 |
| 35-40 | 1.510 | Number | 2019 |
| 40-45 | 1.432 | Number | 2019 |
| 45-50 | 1.715 | Number | 2019 |
| 50-55 | 2.270 | Number | 2019 |
| 55-60 | 2.043 | Number | 2019 |
| 60-65 | 1.623 | Number | 2019 |
| 65-75 | 3.301 | Number | 2019 |
| Women 65-70 | 1.820 | Number | 2019 |
| Men 65-70 | 1.481 | Number | 2019 |
| 75+ | 4.340 | Number | 2019 |
| Women 75+ | 2.625 | Number | 2019 |
| Men 75+ | 1.715 | Number | 2019 |
| % 0-10 | 8% | Percentage | 2019 |
| % 10-18 | 6% | Percentage | 2019 |
| % 18-30 | 13% | Percentage | 2019 |
| % 30-45 | 17% | Percentage | 2019 |
| % 45-60 | 22% | Percentage | 2019 |
| % 60+ | 34% | Percentage | 2019 |
| Real estate | Value | Unit | Year |
|---|---|---|---|
| Property tax A revenue | no data | Euro | no data |
| Property tax B revenue | no data | Euro | no data |
| Trade tax actual revenue | no data | Euro | no data |
| Property tax A basic amount | no data | Euro | no data |
| Property tax B basic amount | no data | Euro | no data |
| Trade tax basic amount | no data | Euro | no data |
| Property tax A rate | no data | Euro | no data |
| Property tax B rate | no data | Euro | no data |
| Trade tax rate | no data | Euro | no data |
| Real tax raising force | no data | Euro | no data |
| Trade tax levy | no data | Euro | no data |
| Trade tax net | no data | Euro | no data |
| Community share in income tax | no data | Euro | no data |
| Community share in sales tax | no data | Euro | no data |
| Tax revenue | no data | Euro | no data |
| Regional | Value | Unit | Year |
|---|---|---|---|
| Region code | 091800117117 | Code | 2019 |
| Region code 8 digits | 09180117 | Code | 09180117 |
| Sorting code | 091800117117 | Code | 091800117117 |
| Sorting code 8 digits | 09180117 | Code | 09180117 |
| Region name | Garmisch-Partenkirchen | Name | 2019 |
| Regional level | 6 | Categorical type | 2019 |
| Region type | Municipality | Categorical type | 2019 |
| Region type detail | municipality | Categorical type | 2019 |
| Region name with type | municipality Garmisch-Partenkirchen | Name | 2019 |
| Region name in German | Gemeinde Garmisch-Partenkirchen | Name | 2019 |
| Direct subregions | no data | Number | 2019 |
| NUTS code | DE21D | Code | 2019 |
| Area | 206 | Area in km² | 2019 |
| Religion | Value | Unit | Year |
|---|---|---|---|
| Roman Catholic church | 13.837 | Number | 2011 |
| Protestant church | 4.170 | Number | 2011 |
| Other or none | 7.574 | Number | 2011 |
| % Roman Catholic church | 54% | Percentage | 2011 |
| % Protestant church | 16% | Percentage | 2011 |
| % Other or none | 30% | Percentage | 2011 |
| Roman Catholic church German | 13.129 | Number | 2011 |
| Protestant church German | 4.079 | Number | 2011 |
| Other or none German | 5.670 | Number | 2011 |
| % Roman Catholic church German | 57% | Percentage | 2011 |
| % Protestant church German | 18% | Percentage | 2011 |
| % Other or none German Foreign | 25% | Percentage | 2011 |
| Roman Catholic church Foreign | 708 | Number | 2011 |
| Protestant church Foreign | 91 | Number | 2011 |
| Other or none Foreign | 1.904 | Number | 2011 |
| % Roman Catholic church Foreign | 26% | Percentage | 2011 |
| % Protestant church Foreign | 3% | Percentage | 2011 |
| % Other or none Foreign | 70% | Percentage | 2011 |
Data is used from multiple German open data providers. See this description of the sources with the definitions of all regional topics.
Sources & definitionsThis page will be further expanded with more topics in clear graphs. This will be done in several iterations in the coming weeks.
![]()
© Published:
 Contents and more information: