One moment please, your device is loading the charts...
Population numbers in the municipality Helmstadt-Bargen for the years 2009 thru 2019.
The number of inhabitants is the number of persons as registered in the population register on January 1st.
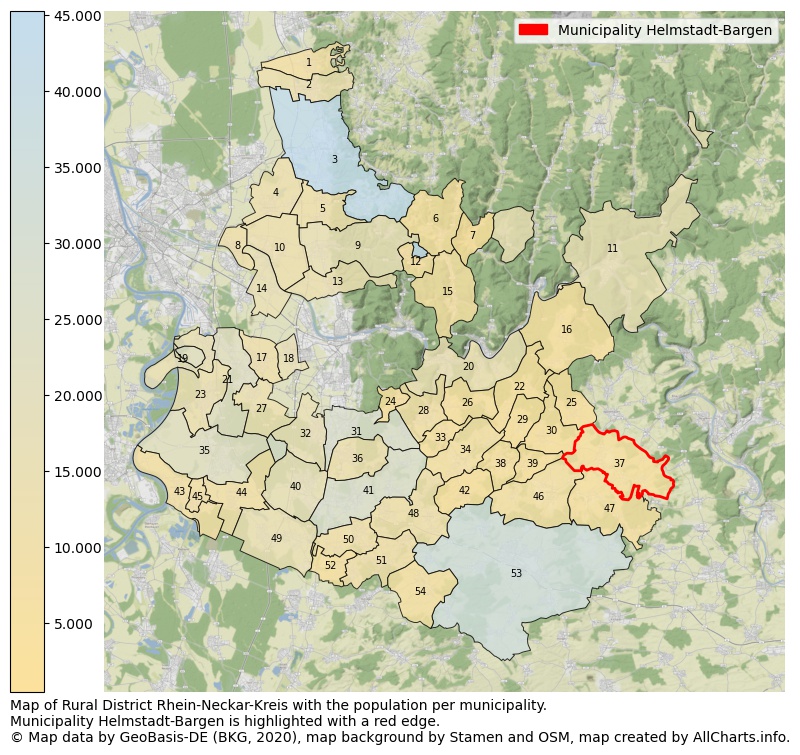
Map of Rural district Rhein-Neckar-Kreis with the population per municipality.Municipality Helmstadt-Bargen is highlighted with a red edge. The numbers at the map represent the following municipalities: 1: municipality Laudenbach, 2: municipality city Hemsbach, 3: municipality city Weinheim, 4: municipality Heddesheim, 5: municipality Hirschberg an der Bergstraße ...Show more... Map of Rural district Rhein-Neckar-Kreis with the population per municipality.Municipality Helmstadt-Bargen is highlighted with a red edge. The numbers at the map represent the following municipalities: 1: municipality Laudenbach, 2: municipality city Hemsbach, 3: municipality city Weinheim, 4: municipality Heddesheim, 5: municipality Hirschberg an der Bergstraße, 6: municipality Heiligkreuzsteinach, 7: municipality Heddesbach, 8: municipality Ilvesheim, 9: municipality city Schriesheim, 10: municipality city Ladenburg, 11: municipality city Eberbach, 12: municipality Wilhelmsfeld, 13: municipality Dossenheim, 14: municipality Edingen-Neckarhausen, 15: municipality city Schönau, 16: municipality Schönbrunn, 17: municipality Plankstadt, 18: municipality city Eppelheim, 19: municipality Brühl, 20: municipality city Neckargemünd, 21: municipality city Schwetzingen, 22: municipality Lobbach, 23: municipality Ketsch, 24: municipality Gaiberg, 25: municipality Reichartshausen, 26: municipality Wiesenbach, 27: municipality Oftersheim, 28: municipality Bammental, 29: municipality Spechbach, 30: municipality Epfenbach, 31: municipality city Leimen, 32: municipality Sandhausen, 33: municipality Mauer, 34: municipality Meckesheim, 35: municipality city Hockenheim, 36: municipality Nußloch, 37: municipality Helmstadt-Bargen, 38: municipality Eschelbronn, 39: municipality Neidenstein, 40: municipality city Walldorf, 41: municipality city Wiesloch, 42: municipality Zuzenhausen, 43: municipality Altlußheim, 44: municipality Reilingen, 45: municipality Neulußheim, 46: municipality city Waibstadt, 47: municipality city Neckarbischofsheim, 48: municipality Dielheim, 49: municipality St. Leon-Rot, 50: municipality city Rauenberg, 51: municipality Mühlhausen, 52: municipality Malsch, 53: municipality city Sinsheim, 54: municipality Angelbachtal ...Show less...
One moment please, your device is loading the charts...
Municipality Helmstadt-Bargen, 2019, number of rooms per house.
The percentage shows the relative share of houses per category based on the numer of rooms: 1 to 2 rooms, 3 to 4 rooms or 5 rooms or more. This is based on the total number of rooms as identified for all dwellings in the municipality Helmstadt-Bargen.
The table below shows data for more than 100 topics as most recently available for the municipality Helmstadt-Bargen. Select a category to display the related topics:
| Business | Value | Unit | Year |
|---|---|---|---|
| Businesses | 2 | Number | 2017 |
| Active persons | 0 | Number | 2017 |
| Gross wages | €0 | Euro | 2017 |
| Dwellings | Value | Unit | Year |
|---|---|---|---|
| Houses 1 room | 7 | Number | 2019 |
| Houses 2 rooms | 43 | Number | 2019 |
| Houses 3 rooms | 196 | Number | 2019 |
| Houses 4 rooms | 336 | Number | 2019 |
| Houses 5 rooms | 329 | Number | 2019 |
| Houses 6 rooms | 342 | Number | 2019 |
| Houses 7+ rooms | 433 | Number | 2019 |
| Houses 1-2 rooms | 50 | Number | 2019 |
| Houses 3-4 rooms | 532 | Number | 2019 |
| Houses 5+ rooms | 1.104 | Number | 2019 |
| 1-2 rooms | 3% | Percentage | 2019 |
| 3-4 rooms | 32% | Percentage | 2019 |
| 5+ rooms | 65% | Percentage | 2019 |
| Elections | Value | Unit | Year |
|---|---|---|---|
| Voters Bundestag | 2864,00 | Number | 2017 |
| Voter turnout Bundestag | 72 | Number | 2017 |
| Votes valid Bundestag | 1.720 | Number | 2017 |
| Votes Bundestag CDU/CSU | 619 | Number | 2017 |
| Votes Bundestag SPD | 316 | Number | 2017 |
| Votes Bundestag GRÜNE | 167 | Number | 2017 |
| Votes Bundestag FDP | 165 | Number | 2017 |
| Votes Bundestag DIE LINKE | 103 | Number | 2017 |
| Votes Bundestag AfD | 262 | Number | 2017 |
| Votes Bundestag other parties | 88 | Number | 2017 |
| Votes Bundestag total | 1.720 | Number | 2017 |
| % Votes Bundestag CDU/CSU | 22% | Percentage | 2017 |
| % Votes Bundestag SPD | 11% | Percentage | 2017 |
| % Votes Bundestag GRÜNE | 6% | Percentage | 2017 |
| % Votes Bundestag FDP | 6% | Percentage | 2017 |
| % Votes Bundestag DIE LINKE | 4% | Percentage | 2017 |
| % Votes Bundestag AfD | 9% | Percentage | 2017 |
| % Votes Bundestag other parties | 3% | Percentage | 2017 |
| Employment | Value | Unit | Year |
|---|---|---|---|
| Employees | 1.611 | Number | 2019 |
| Employees male | 875 | Number | 2019 |
| Employees female | 736 | Number | 2019 |
| Employees foreigner | 146 | Number | 2019 |
| Employees male foreigner | 100 | Number | 2019 |
| Employees female foreigner | 46 | Number | 2019 |
| Unemployed | 58 | Number | 2018 |
| Unemployed foreigners | 11 | Number | 2018 |
| Unemployed severely disabled | 5 | Number | 2018 |
| Unemployed 15-20 | 1 | Number | 2018 |
| Unemployed 15-25 | 4 | Number | 2018 |
| Unemployed 55-65 | 19 | Number | 2018 |
| Unemployed long-term | 17 | Number | 2018 |
| % Unemployed | 2% | Percentage | 2018 |
| % Unemployed foreigners | 0% | Percentage of the population | 2018 |
| % Unemployed severely disabled | 0% | Percentage of the population | 2018 |
| % Unemployed 15-20 | 0% | Percentage of the population | 2018 |
| % Unemployed 15-25 | 0% | Percentage of the population | 2018 |
| % Unemployed 55-65 | 1% | Percentage of the population | 2018 |
| % Unemployed long-term | 0% | Percentage of the population | 2018 |
| Income | Value | Unit | Year |
|---|---|---|---|
| Income receivers | 1.795 | Number | 2015 |
| Income total | €66.877 | Euro | 2015 |
| Income tax | €10.482 | Euro | 2015 |
| Population | Value | Unit | Year |
|---|---|---|---|
| Population | 3.739 | Number | 2019 |
| Men | 1.887 | Number | 2019 |
| Women | 1.852 | Number | 2019 |
| % Men | 50% | Percentage | 2019 |
| % Women | 50% | Percentage | 2019 |
| 0-18 | 626 | Number | 2019 |
| 18-30 | 491 | Number | 2019 |
| 30-45 | 655 | Number | 2019 |
| 45-60 | 932 | Number | 2019 |
| 18-60 | 2.078 | Number | 2019 |
| 60-75 | 686 | Number | 2019 |
| 60+ | 1.035 | Number | 2019 |
| Average age | 44 | Average number | 2019 |
| Average age male | 43 | Average number | 2019 |
| Average age female | 46 | Average number | 2019 |
| Births | 32 | Number | 2018 |
| Births male | 14 | Number | 2018 |
| Births female | 18 | Number | 2018 |
| 1K Births | 9 | Number per 1000 inhabitants | 2018 |
| Deaths | 28 | Number | 2018 |
| Deaths male | 15 | Number | 2018 |
| Deaths female | 13 | Number | 2018 |
| 1K Deaths | 8 | Number | 2018 |
| 0-3 | 106 | Number | 2019 |
| Girls 0-3 | 51 | Number | 2019 |
| Boys 0-3 | 55 | Number | 2019 |
| 3-6 | 116 | Number | 2019 |
| Girls 3-6 | 52 | Number | 2019 |
| Boys 3-6 | 64 | Number | 2019 |
| 6-10 | 117 | Number | 2019 |
| 10-15 | 167 | Number | 2019 |
| 15-18 | 120 | Number | 2019 |
| 18-20 | 91 | Number | 2019 |
| 20-25 | 201 | Number | 2019 |
| 25-30 | 199 | Number | 2019 |
| 30-35 | 238 | Number | 2019 |
| 35-40 | 218 | Number | 2019 |
| 40-45 | 199 | Number | 2019 |
| 45-50 | 250 | Number | 2019 |
| 50-55 | 317 | Number | 2019 |
| 55-60 | 365 | Number | 2019 |
| 60-65 | 307 | Number | 2019 |
| 65-75 | 379 | Number | 2019 |
| Women 65-70 | 188 | Number | 2019 |
| Men 65-70 | 191 | Number | 2019 |
| 75+ | 349 | Number | 2019 |
| Women 75+ | 195 | Number | 2019 |
| Men 75+ | 154 | Number | 2019 |
| % 0-10 | 9% | Percentage | 2019 |
| % 10-18 | 8% | Percentage | 2019 |
| % 18-30 | 13% | Percentage | 2019 |
| % 30-45 | 18% | Percentage | 2019 |
| % 45-60 | 25% | Percentage | 2019 |
| % 60+ | 28% | Percentage | 2019 |
| Real estate | Value | Unit | Year |
|---|---|---|---|
| Property tax A revenue | no data | Euro | no data |
| Property tax B revenue | no data | Euro | no data |
| Trade tax actual revenue | no data | Euro | no data |
| Property tax A basic amount | no data | Euro | no data |
| Property tax B basic amount | no data | Euro | no data |
| Trade tax basic amount | no data | Euro | no data |
| Property tax A rate | no data | Euro | no data |
| Property tax B rate | no data | Euro | no data |
| Trade tax rate | no data | Euro | no data |
| Real tax raising force | no data | Euro | no data |
| Trade tax levy | no data | Euro | no data |
| Trade tax net | no data | Euro | no data |
| Community share in income tax | no data | Euro | no data |
| Community share in sales tax | no data | Euro | no data |
| Tax revenue | no data | Euro | no data |
| Regional | Value | Unit | Year |
|---|---|---|---|
| Region code | 082265009106 | Code | 2019 |
| Region code 8 digits | 08226106 | Code | 08226106 |
| Sorting code | 082265009106 | Code | 082265009106 |
| Sorting code 8 digits | 08226106 | Code | 08226106 |
| Region name | Helmstadt-Bargen | Name | 2019 |
| Regional level | 6 | Categorical type | 2019 |
| Region type | Municipality | Categorical type | 2019 |
| Region type detail | municipality | Categorical type | 2019 |
| Region name with type | municipality Helmstadt-Bargen | Name | 2019 |
| Region name in German | Gemeinde Helmstadt-Bargen | Name | 2019 |
| Direct subregions | no data | Number | 2019 |
| NUTS code | DE128 | Code | 2019 |
| Area | 28 | Area in km² | 2019 |
| Religion | Value | Unit | Year |
|---|---|---|---|
| Roman Catholic church | 1.109 | Number | 2011 |
| Protestant church | 1.874 | Number | 2011 |
| Other or none | 784 | Number | 2011 |
| % Roman Catholic church | 29% | Percentage | 2011 |
| % Protestant church | 50% | Percentage | 2011 |
| % Other or none | 21% | Percentage | 2011 |
| Roman Catholic church German | 1.064 | Number | 2011 |
| Protestant church German | 1.865 | Number | 2011 |
| Other or none German | 647 | Number | 2011 |
| % Roman Catholic church German | 30% | Percentage | 2011 |
| % Protestant church German | 52% | Percentage | 2011 |
| % Other or none German Foreign | 18% | Percentage | 2011 |
| Roman Catholic church Foreign | 45 | Number | 2011 |
| Protestant church Foreign | 9 | Number | 2011 |
| Other or none Foreign | 137 | Number | 2011 |
| % Roman Catholic church Foreign | 24% | Percentage | 2011 |
| % Protestant church Foreign | 5% | Percentage | 2011 |
| % Other or none Foreign | 72% | Percentage | 2011 |
Data is used from multiple German open data providers. See this description of the sources with the definitions of all regional topics.
Sources & definitionsThis page will be further expanded with more topics in clear graphs. This will be done in several iterations in the coming weeks.
![]()
© Published:
 Contents and more information: