Population numbers per year
The number of inhabitants in the municipality Heringsdorf
One moment please, your device is loading the charts...
Population numbers in the municipality Heringsdorf for the years 2012 thru 2019.
The number of inhabitants is the number of persons as registered in the population register on January 1st.
Population at the map of Heringsdorf
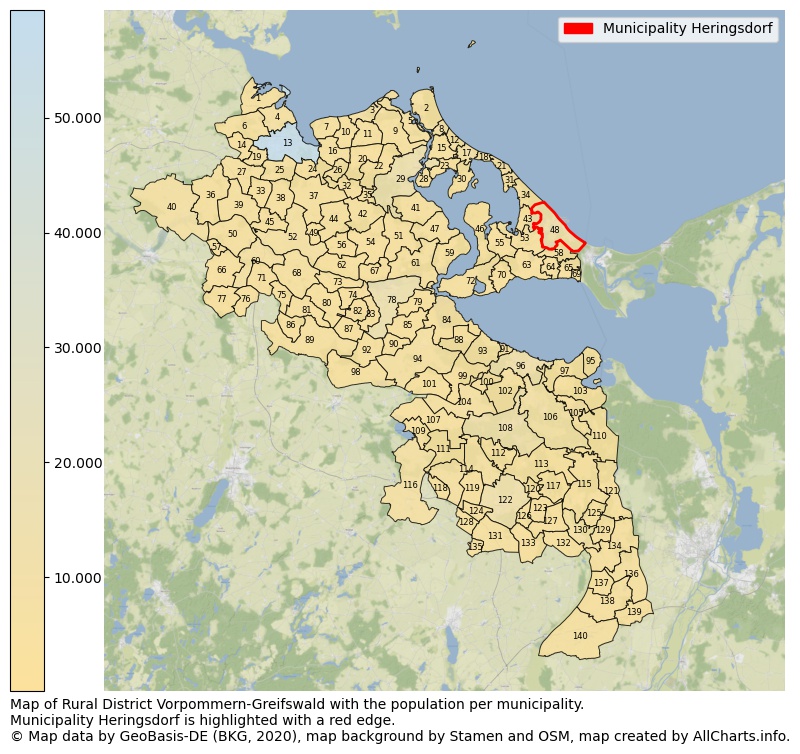
Map of Rural district Vorpommern-Greifswald with the population per municipality.Municipality Heringsdorf is highlighted with a red edge. The numbers at the map represent the following municipalities: 1: municipality Mesekenhagen, 2: municipality Peenemünde, 3: municipality Lubmin, 4: municipality Neuenkirchen, 5: municipality Kröslin ...Show more... Map of Rural district Vorpommern-Greifswald with the population per municipality.Municipality Heringsdorf is highlighted with a red edge. The numbers at the map represent the following municipalities: 1: municipality Mesekenhagen, 2: municipality Peenemünde, 3: municipality Lubmin, 4: municipality Neuenkirchen, 5: municipality Kröslin, 6: municipality Wackerow, 7: municipality Loissin, 8: municipality Karlshagen, 9: municipality Rubenow, 10: municipality Brünzow, 11: municipality Wusterhusen, 12: municipality Trassenheide, 13: municipality city Gripswald, 14: municipality Levenhagen, 15: municipality Mölschow, 16: municipality Kemnitz, 17: municipality Zinnowitz, 18: municipality Zempin, 19: municipality Hinrichshagen, 20: municipality Neu Boltenhagen, 21: municipality Koserow, 22: municipality Katzow, 23: municipality Krummin, 24: municipality Diedrichshagen, 25: municipality Weitenhagen, 26: municipality Hanshagen, 27: municipality Dersekow, 28: municipality Sauzin, 29: municipality city Wolgast, 30: municipality Lütow, 31: municipality Loddin, 32: municipality Wrangelsburg, 33: municipality Dargelin, 34: municipality Ückeritz, 35: municipality Lühmannsdorf, 36: municipality Sassen-Trantow, 37: municipality Groß Kiesow, 38: municipality Behrenhoff, 39: municipality Görmin, 40: municipality city Loitz, 41: municipality Zemitz, 42: municipality Karlsburg, 43: municipality Pudagla, 44: municipality Züssow, 45: municipality Bandelin, 46: municipality Rankwitz, 47: municipality city Lassan, 48: municipality Heringsdorf, 49: municipality Gribow, 50: municipality Bentzin, 51: municipality Rubkow, 52: municipality city Gützkow, 53: municipality Benz, 54: municipality Klein Bünzow, 55: municipality Mellenthin, 56: municipality Schmatzin, 57: municipality Tutow, 58: municipality Korswandt, 59: municipality Buggenhagen, 60: municipality city Jarmen, 61: municipality Murchin, 62: municipality Groß Polzin, 63: municipality Dargen, 64: municipality Zirchow, 65: municipality Garz, 66: municipality Kruckow, 67: municipality Ziethen, 68: municipality Neetzow-Liepen, 69: municipality Kamminke, 70: municipality Stolpe auf Usedom, 71: municipality Völschow, 72: municipality city Usedom, 73: municipality Stolpe an der Peene, 74: municipality Postlow, 75: municipality Krusenfelde, 76: municipality Daberkow, 77: municipality Alt Tellin, 78: municipality city Anklam, 79: municipality Bargischow, 80: municipality Medow, 81: municipality Krien, 82: municipality Blesewitz, 83: municipality Butzow, 84: municipality Bugewitz, 85: municipality Neu Kosenow, 86: municipality Iven, 87: municipality Neuenkirchen, 88: municipality Leopoldshagen, 89: municipality Spantekow, 90: municipality Rossin, 91: municipality Grambin, 92: municipality Sarnow, 93: municipality Mönkebude, 94: municipality Ducherow, 95: municipality Altwarp, 96: municipality city Ueckermünde, 97: municipality Vogelsang-Warsin, 98: municipality Boldekow, 99: municipality Lübs, 100: municipality Meiersberg, 101: municipality Altwigshagen, 102: municipality Liepgarten, 103: municipality Luckow, 104: municipality Ferdinandshof, 105: municipality Ahlbeck, 106: municipality city Eggesin, 107: municipality Wilhelmsburg, 108: municipality city Torgelow, 109: municipality Heinrichswalde, 110: municipality Hintersee, 111: municipality Rothemühl, 112: municipality Hammer a.d. Uecker, 113: municipality Viereck, 114: municipality Jatznick, 115: municipality Rothenklempenow, 116: municipality city Strasburg (Uckermark), 117: municipality Koblentz, 118: municipality Groß Luckow, 119: municipality Schönwalde, 120: municipality Krugsdorf, 121: municipality Blankensee, 122: municipality city Pasewalk, 123: municipality Zerrenthin, 124: municipality Papendorf, 125: municipality Boock, 126: municipality Polzow, 127: municipality Rossow, 128: municipality Brietzig, 129: municipality Plöwen, 130: municipality Löcknitz, 131: municipality Rollwitz, 132: municipality Bergholz, 133: municipality Fahrenwalde, 134: municipality Ramin, 135: municipality Nieden, 136: municipality Grambow, 137: municipality Glasow, 138: municipality Krackow, 139: municipality Nadrensee, 140: municipality city Penkun ...Show less...
The number of rooms per house (dwelling)
The number of rooms of the houses in the municipality Heringsdorf
One moment please, your device is loading the charts...
Municipality Heringsdorf, 2019, number of rooms per house.
The percentage shows the relative share of houses per category based on the numer of rooms: 1 to 2 rooms, 3 to 4 rooms or 5 rooms or more. This is based on the total number of rooms as identified for all dwellings in the municipality Heringsdorf.
Data about more than 100 topics!
The table below shows data for more than 100 topics as most recently available for the municipality Heringsdorf. Select a category to display the related topics:
| Business | Value | Unit | Year |
|---|---|---|---|
| Businesses | 1 | Number | 2017 |
| Active persons | 0 | Number | 2017 |
| Gross wages | €0 | Euro | 2017 |
| Dwellings | Value | Unit | Year |
|---|---|---|---|
| Houses 1 room | 316 | Number | 2019 |
| Houses 2 rooms | 1.112 | Number | 2019 |
| Houses 3 rooms | 1.805 | Number | 2019 |
| Houses 4 rooms | 1.307 | Number | 2019 |
| Houses 5 rooms | 694 | Number | 2019 |
| Houses 6 rooms | 369 | Number | 2019 |
| Houses 7+ rooms | 304 | Number | 2019 |
| Houses 1-2 rooms | 1.428 | Number | 2019 |
| Houses 3-4 rooms | 3.112 | Number | 2019 |
| Houses 5+ rooms | 1.367 | Number | 2019 |
| 1-2 rooms | 24% | Percentage | 2019 |
| 3-4 rooms | 53% | Percentage | 2019 |
| 5+ rooms | 23% | Percentage | 2019 |
| Elections | Value | Unit | Year |
|---|---|---|---|
| Voters Bundestag | 7243,00 | Number | 2017 |
| Voter turnout Bundestag | 54 | Number | 2017 |
| Votes valid Bundestag | 3.877 | Number | 2017 |
| Votes Bundestag CDU/CSU | 1.224 | Number | 2017 |
| Votes Bundestag SPD | 394 | Number | 2017 |
| Votes Bundestag GRÜNE | 91 | Number | 2017 |
| Votes Bundestag FDP | 261 | Number | 2017 |
| Votes Bundestag DIE LINKE | 570 | Number | 2017 |
| Votes Bundestag AfD | 1.111 | Number | 2017 |
| Votes Bundestag other parties | 226 | Number | 2017 |
| Votes Bundestag total | 3.877 | Number | 2017 |
| % Votes Bundestag CDU/CSU | 17% | Percentage | 2017 |
| % Votes Bundestag SPD | 5% | Percentage | 2017 |
| % Votes Bundestag GRÜNE | 1% | Percentage | 2017 |
| % Votes Bundestag FDP | 4% | Percentage | 2017 |
| % Votes Bundestag DIE LINKE | 8% | Percentage | 2017 |
| % Votes Bundestag AfD | 15% | Percentage | 2017 |
| % Votes Bundestag other parties | 3% | Percentage | 2017 |
| Employment | Value | Unit | Year |
|---|---|---|---|
| Employees | 3.282 | Number | 2019 |
| Employees male | 1.499 | Number | 2019 |
| Employees female | 1.783 | Number | 2019 |
| Employees foreigner | 192 | Number | 2019 |
| Employees male foreigner | 90 | Number | 2019 |
| Employees female foreigner | 102 | Number | 2019 |
| Unemployed | 264 | Number | 2018 |
| Unemployed foreigners | 27 | Number | 2018 |
| Unemployed severely disabled | 18 | Number | 2018 |
| Unemployed 15-20 | 3 | Number | 2018 |
| Unemployed 15-25 | 16 | Number | 2018 |
| Unemployed 55-65 | 89 | Number | 2018 |
| Unemployed long-term | 67 | Number | 2018 |
| % Unemployed | 3% | Percentage | 2018 |
| % Unemployed foreigners | 0% | Percentage of the population | 2018 |
| % Unemployed severely disabled | 0% | Percentage of the population | 2018 |
| % Unemployed 15-20 | 0% | Percentage of the population | 2018 |
| % Unemployed 15-25 | 0% | Percentage of the population | 2018 |
| % Unemployed 55-65 | 1% | Percentage of the population | 2018 |
| % Unemployed long-term | 1% | Percentage of the population | 2018 |
| Income | Value | Unit | Year |
|---|---|---|---|
| Income receivers | 4.225 | Number | 2015 |
| Income total | €121.636 | Euro | 2015 |
| Income tax | €16.480 | Euro | 2015 |
| Population | Value | Unit | Year |
|---|---|---|---|
| Population | 8.547 | Number | 2019 |
| Men | 4.036 | Number | 2019 |
| Women | 4.511 | Number | 2019 |
| % Men | 47% | Percentage | 2019 |
| % Women | 53% | Percentage | 2019 |
| 0-18 | 1.001 | Number | 2019 |
| 18-30 | 671 | Number | 2019 |
| 30-45 | 1.419 | Number | 2019 |
| 45-60 | 2.002 | Number | 2019 |
| 18-60 | 4.092 | Number | 2019 |
| 60-75 | 2.010 | Number | 2019 |
| 60+ | 3.454 | Number | 2019 |
| Average age | 51 | Average number | 2019 |
| Average age male | 50 | Average number | 2019 |
| Average age female | 52 | Average number | 2019 |
| Births | 51 | Number | 2018 |
| Births male | 24 | Number | 2018 |
| Births female | 27 | Number | 2018 |
| 1K Births | 6 | Number per 1000 inhabitants | 2018 |
| Deaths | 122 | Number | 2018 |
| Deaths male | 59 | Number | 2018 |
| Deaths female | 63 | Number | 2018 |
| 1K Deaths | 14 | Number | 2018 |
| 0-3 | 173 | Number | 2019 |
| Girls 0-3 | 88 | Number | 2019 |
| Boys 0-3 | 85 | Number | 2019 |
| 3-6 | 143 | Number | 2019 |
| Girls 3-6 | 74 | Number | 2019 |
| Boys 3-6 | 69 | Number | 2019 |
| 6-10 | 212 | Number | 2019 |
| 10-15 | 286 | Number | 2019 |
| 15-18 | 187 | Number | 2019 |
| 18-20 | 119 | Number | 2019 |
| 20-25 | 245 | Number | 2019 |
| 25-30 | 307 | Number | 2019 |
| 30-35 | 496 | Number | 2019 |
| 35-40 | 487 | Number | 2019 |
| 40-45 | 436 | Number | 2019 |
| 45-50 | 521 | Number | 2019 |
| 50-55 | 656 | Number | 2019 |
| 55-60 | 825 | Number | 2019 |
| 60-65 | 776 | Number | 2019 |
| 65-75 | 1.234 | Number | 2019 |
| Women 65-70 | 632 | Number | 2019 |
| Men 65-70 | 602 | Number | 2019 |
| 75+ | 1.444 | Number | 2019 |
| Women 75+ | 890 | Number | 2019 |
| Men 75+ | 554 | Number | 2019 |
| % 0-10 | 6% | Percentage | 2019 |
| % 10-18 | 6% | Percentage | 2019 |
| % 18-30 | 8% | Percentage | 2019 |
| % 30-45 | 17% | Percentage | 2019 |
| % 45-60 | 23% | Percentage | 2019 |
| % 60+ | 40% | Percentage | 2019 |
| Real estate | Value | Unit | Year |
|---|---|---|---|
| Property tax A revenue | no data | Euro | no data |
| Property tax B revenue | no data | Euro | no data |
| Trade tax actual revenue | no data | Euro | no data |
| Property tax A basic amount | no data | Euro | no data |
| Property tax B basic amount | no data | Euro | no data |
| Trade tax basic amount | no data | Euro | no data |
| Property tax A rate | no data | Euro | no data |
| Property tax B rate | no data | Euro | no data |
| Trade tax rate | no data | Euro | no data |
| Real tax raising force | no data | Euro | no data |
| Trade tax levy | no data | Euro | no data |
| Trade tax net | no data | Euro | no data |
| Community share in income tax | no data | Euro | no data |
| Community share in sales tax | no data | Euro | no data |
| Tax revenue | no data | Euro | no data |
| Regional | Value | Unit | Year |
|---|---|---|---|
| Region code | 130750049049 | Code | 2019 |
| Region code 8 digits | 13075049 | Code | 13075049 |
| Sorting code | 130750049049 | Code | 130750049049 |
| Sorting code 8 digits | 13075049 | Code | 13075049 |
| Region name | Heringsdorf | Name | 2019 |
| Regional level | 6 | Categorical type | 2019 |
| Region type | Municipality | Categorical type | 2019 |
| Region type detail | municipality | Categorical type | 2019 |
| Region name with type | municipality Heringsdorf | Name | 2019 |
| Region name in German | Gemeinde Heringsdorf | Name | 2019 |
| Direct subregions | no data | Number | 2019 |
| NUTS code | DE80N | Code | 2019 |
| Area | 38 | Area in km² | 2019 |
| Religion | Value | Unit | Year |
|---|---|---|---|
| Roman Catholic church | no data | Number | no data |
| Protestant church | no data | Number | no data |
| Other or none | no data | Number | no data |
| % Roman Catholic church | no data | Percentage | no data |
| % Protestant church | no data | Percentage | no data |
| % Other or none | no data | Percentage | no data |
| Roman Catholic church German | no data | Number | no data |
| Protestant church German | no data | Number | no data |
| Other or none German | no data | Number | no data |
| % Roman Catholic church German | no data | Percentage | no data |
| % Protestant church German | no data | Percentage | no data |
| % Other or none German Foreign | no data | Percentage | no data |
| Roman Catholic church Foreign | no data | Number | no data |
| Protestant church Foreign | no data | Number | no data |
| Other or none Foreign | no data | Number | no data |
| % Roman Catholic church Foreign | no data | Percentage | no data |
| % Protestant church Foreign | no data | Percentage | no data |
| % Other or none Foreign | no data | Percentage | no data |
Open data sources used
Data is used from multiple German open data providers. See this description of the sources with the definitions of all regional topics.
Sources & definitionsUnder development
Work is in progress to add more information to this page
This page will be further expanded with more topics in clear graphs. This will be done in several iterations in the coming weeks.