Population numbers per year
The number of inhabitants in the municipality Hürup
One moment please, your device is loading the charts...
Population numbers in the municipality Hürup for the years 2009 thru 2019.
The number of inhabitants is the number of persons as registered in the population register on January 1st.
Population at the map of Hürup
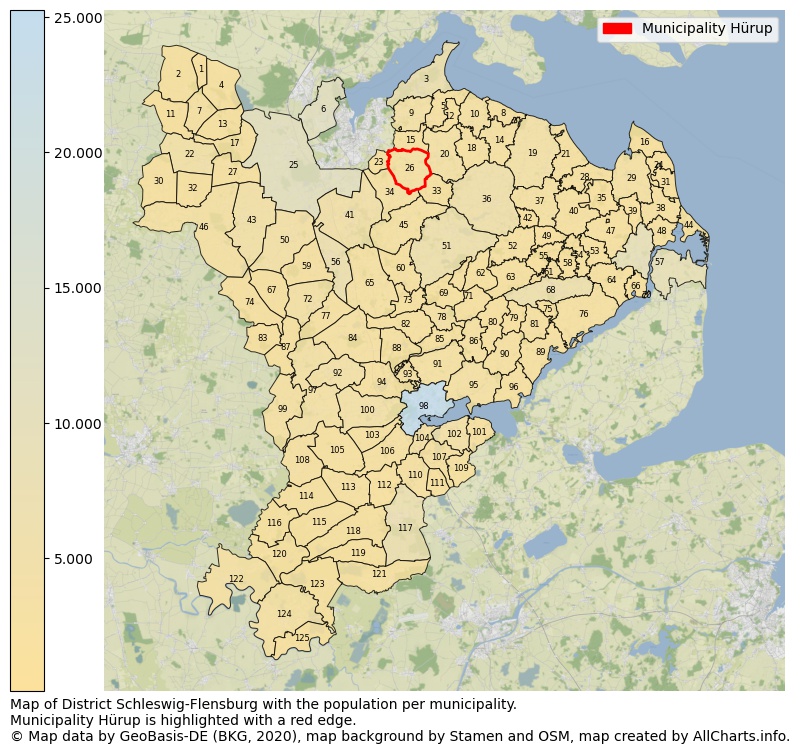
Map of District Schleswig-Flensburg with the population per municipality.Municipality Hürup is highlighted with a red edge. The numbers at the map represent the following municipalities: 1: municipality Böxlund, 2: municipality Weesby, 3: municipality city Glücksburg (Ostsee), 4: municipality Jardelund, 5: municipality Munkbrarup ...Show more... Map of District Schleswig-Flensburg with the population per municipality.Municipality Hürup is highlighted with a red edge. The numbers at the map represent the following municipalities: 1: municipality Böxlund, 2: municipality Weesby, 3: municipality city Glücksburg (Ostsee), 4: municipality Jardelund, 5: municipality Munkbrarup, 6: municipality Harrislee, 7: municipality Medelby, 8: municipality Westerholz, 9: municipality Wees, 10: municipality Langballig, 11: municipality Holt, 12: municipality Ringsberg, 13: municipality Osterby, 14: municipality Dollerup, 15: municipality Maasbüll, 16: municipality Nieby, 17: municipality Wallsbüll, 18: municipality Grundhof, 19: municipality Steinbergkirche, 20: municipality Husby, 21: municipality Steinberg, 22: municipality Schafflund, 23: municipality Tastrup, 24: municipality Pommerby, 25: municipality Handewitt, 26: municipality Hürup, 27: municipality Meyn, 28: municipality Niesgrau, 29: municipality Gelting, 30: municipality Hörup, 31: municipality Kronsgaard, 32: municipality Nordhackstedt, 33: municipality Ausacker, 34: municipality Freienwill, 35: municipality Stangheck, 36: municipality Sörup, 37: municipality Sterup, 38: municipality Hasselberg, 39: municipality Rabenholz, 40: municipality Esgrus, 41: municipality Oeversee, 42: municipality Ahneby, 43: municipality Großenwiehe, 44: municipality Maasholm, 45: municipality Großsolt, 46: municipality Lindewitt, 47: municipality Stoltebüll, 48: municipality Rabel, 49: municipality Rügge, 50: municipality Wanderup, 51: municipality Mittelangeln, 52: municipality Mohrkirch, 53: municipality Oersberg, 54: municipality Scheggerott, 55: municipality Saustrup, 56: municipality Tarp, 57: municipality city Kappeln, 58: municipality Wagersrott, 59: municipality Jerrishoe, 60: municipality Havetoft, 61: municipality Norderbrarup, 62: municipality Schnarup-Thumby, 63: municipality Böel, 64: municipality Rabenkirchen-Faulück, 65: municipality Sieverstedt, 66: municipality Grödersby, 67: municipality Janneby, 68: municipality Süderbrarup, 69: municipality Uelsby, 70: municipality city Arnis, 71: municipality Struxdorf, 72: municipality Eggebek, 73: municipality Klappholz, 74: municipality Jörl, 75: municipality Nottfeld, 76: municipality Boren, 77: municipality Langstedt, 78: municipality Böklund, 79: municipality Loit, 80: municipality Twedt, 81: municipality Steinfeld, 82: municipality Stolk, 83: municipality Süderhackstedt, 84: municipality Bollingstedt, 85: municipality Süderfahrenstedt, 86: municipality Tolk, 87: municipality Sollerup, 88: municipality Idstedt, 89: municipality Ulsnis, 90: municipality Taarstedt, 91: municipality Nübel, 92: municipality Jübek, 93: municipality Neuberend, 94: municipality Lürschau, 95: municipality Schaalby, 96: municipality Brodersby-Goltoft, 97: municipality Silberstedt, 98: municipality city Schleswig, 99: municipality Treia, 100: municipality Schuby, 101: municipality Borgwedel, 102: municipality Fahrdorf, 103: municipality Hüsby, 104: municipality Busdorf, 105: municipality Ellingstedt, 106: municipality Dannewerk, 107: municipality Selk, 108: municipality Hollingstedt, 109: municipality Geltorf, 110: municipality Jagel, 111: municipality Lottorf, 112: municipality Klein Rheide, 113: municipality Groß Rheide, 114: municipality Dörpstedt, 115: municipality Börm, 116: municipality Wohlde, 117: municipality Kropp, 118: municipality Klein Bennebek, 119: municipality Alt Bennebek, 120: municipality Bergenhusen, 121: municipality Tetenhusen, 122: municipality Stapel, 123: municipality Meggerdorf, 124: municipality Erfde, 125: municipality Tielen ...Show less...
The number of rooms per house (dwelling)
The number of rooms of the houses in the municipality Hürup
One moment please, your device is loading the charts...
Municipality Hürup, 2019, number of rooms per house.
The percentage shows the relative share of houses per category based on the numer of rooms: 1 to 2 rooms, 3 to 4 rooms or 5 rooms or more. This is based on the total number of rooms as identified for all dwellings in the municipality Hürup.
Data about more than 100 topics!
The table below shows data for more than 100 topics as most recently available for the municipality Hürup. Select a category to display the related topics:
| Business | Value | Unit | Year |
|---|---|---|---|
| Businesses | no data | Number | 2015 |
| Active persons | no data | Number | 2015 |
| Gross wages | no data | Euro | 2015 |
| Dwellings | Value | Unit | Year |
|---|---|---|---|
| Houses 1 room | 1 | Number | 2019 |
| Houses 2 rooms | 15 | Number | 2019 |
| Houses 3 rooms | 65 | Number | 2019 |
| Houses 4 rooms | 96 | Number | 2019 |
| Houses 5 rooms | 121 | Number | 2019 |
| Houses 6 rooms | 130 | Number | 2019 |
| Houses 7+ rooms | 134 | Number | 2019 |
| Houses 1-2 rooms | 16 | Number | 2019 |
| Houses 3-4 rooms | 161 | Number | 2019 |
| Houses 5+ rooms | 385 | Number | 2019 |
| 1-2 rooms | 3% | Percentage | 2019 |
| 3-4 rooms | 29% | Percentage | 2019 |
| 5+ rooms | 69% | Percentage | 2019 |
| Elections | Value | Unit | Year |
|---|---|---|---|
| Voters Bundestag | 978,00 | Number | 2017 |
| Voter turnout Bundestag | 71 | Number | 2017 |
| Votes valid Bundestag | 693 | Number | 2017 |
| Votes Bundestag CDU/CSU | 244 | Number | 2017 |
| Votes Bundestag SPD | 174 | Number | 2017 |
| Votes Bundestag GRÜNE | 111 | Number | 2017 |
| Votes Bundestag FDP | 77 | Number | 2017 |
| Votes Bundestag DIE LINKE | 51 | Number | 2017 |
| Votes Bundestag AfD | 24 | Number | 2017 |
| Votes Bundestag other parties | 12 | Number | 2017 |
| Votes Bundestag total | 693 | Number | 2017 |
| % Votes Bundestag CDU/CSU | 25% | Percentage | 2017 |
| % Votes Bundestag SPD | 18% | Percentage | 2017 |
| % Votes Bundestag GRÜNE | 11% | Percentage | 2017 |
| % Votes Bundestag FDP | 8% | Percentage | 2017 |
| % Votes Bundestag DIE LINKE | 5% | Percentage | 2017 |
| % Votes Bundestag AfD | 2% | Percentage | 2017 |
| % Votes Bundestag other parties | 1% | Percentage | 2017 |
| Employment | Value | Unit | Year |
|---|---|---|---|
| Employees | 444 | Number | 2019 |
| Employees male | 231 | Number | 2019 |
| Employees female | 213 | Number | 2019 |
| Employees foreigner | 8 | Number | 2019 |
| Employees male foreigner | 5 | Number | 2019 |
| Employees female foreigner | 3 | Number | 2019 |
| Unemployed | 15 | Number | 2018 |
| Unemployed foreigners | 3 | Number | 2018 |
| Unemployed severely disabled | 0 | Number | 2018 |
| Unemployed 15-20 | 0 | Number | 2018 |
| Unemployed 15-25 | 2 | Number | 2018 |
| Unemployed 55-65 | 4 | Number | 2018 |
| Unemployed long-term | 3 | Number | 2018 |
| % Unemployed | 1% | Percentage | 2018 |
| % Unemployed foreigners | 0% | Percentage of the population | 2018 |
| % Unemployed severely disabled | 0% | Percentage of the population | 2018 |
| % Unemployed 15-20 | 0% | Percentage of the population | 2018 |
| % Unemployed 15-25 | 0% | Percentage of the population | 2018 |
| % Unemployed 55-65 | 0% | Percentage of the population | 2018 |
| % Unemployed long-term | 0% | Percentage of the population | 2018 |
| Income | Value | Unit | Year |
|---|---|---|---|
| Income receivers | 574 | Number | 2015 |
| Income total | €24.871 | Euro | 2015 |
| Income tax | €4.310 | Euro | 2015 |
| Population | Value | Unit | Year |
|---|---|---|---|
| Population | 1.240 | Number | 2019 |
| Men | 634 | Number | 2019 |
| Women | 606 | Number | 2019 |
| % Men | 51% | Percentage | 2019 |
| % Women | 49% | Percentage | 2019 |
| 0-18 | 204 | Number | 2019 |
| 18-30 | 135 | Number | 2019 |
| 30-45 | 188 | Number | 2019 |
| 45-60 | 350 | Number | 2019 |
| 18-60 | 673 | Number | 2019 |
| 60-75 | 213 | Number | 2019 |
| 60+ | 363 | Number | 2019 |
| Average age | 46 | Average number | 2019 |
| Average age male | 46 | Average number | 2019 |
| Average age female | 46 | Average number | 2019 |
| Births | 11 | Number | 2018 |
| Births male | 7 | Number | 2018 |
| Births female | 4 | Number | 2018 |
| 1K Births | 9 | Number per 1000 inhabitants | 2018 |
| Deaths | 17 | Number | 2018 |
| Deaths male | 8 | Number | 2018 |
| Deaths female | 9 | Number | 2018 |
| 1K Deaths | 14 | Number | 2018 |
| 0-3 | 41 | Number | 2019 |
| Girls 0-3 | 19 | Number | 2019 |
| Boys 0-3 | 22 | Number | 2019 |
| 3-6 | 36 | Number | 2019 |
| Girls 3-6 | 24 | Number | 2019 |
| Boys 3-6 | 12 | Number | 2019 |
| 6-10 | 29 | Number | 2019 |
| 10-15 | 52 | Number | 2019 |
| 15-18 | 46 | Number | 2019 |
| 18-20 | 27 | Number | 2019 |
| 20-25 | 57 | Number | 2019 |
| 25-30 | 51 | Number | 2019 |
| 30-35 | 67 | Number | 2019 |
| 35-40 | 62 | Number | 2019 |
| 40-45 | 59 | Number | 2019 |
| 45-50 | 92 | Number | 2019 |
| 50-55 | 148 | Number | 2019 |
| 55-60 | 110 | Number | 2019 |
| 60-65 | 93 | Number | 2019 |
| 65-75 | 120 | Number | 2019 |
| Women 65-70 | 60 | Number | 2019 |
| Men 65-70 | 60 | Number | 2019 |
| 75+ | 150 | Number | 2019 |
| Women 75+ | 77 | Number | 2019 |
| Men 75+ | 73 | Number | 2019 |
| % 0-10 | 9% | Percentage | 2019 |
| % 10-18 | 8% | Percentage | 2019 |
| % 18-30 | 11% | Percentage | 2019 |
| % 30-45 | 15% | Percentage | 2019 |
| % 45-60 | 28% | Percentage | 2019 |
| % 60+ | 29% | Percentage | 2019 |
| Real estate | Value | Unit | Year |
|---|---|---|---|
| Property tax A revenue | €22.158 | Euro | 2018 |
| Property tax B revenue | €143.570 | Euro | 2018 |
| Trade tax actual revenue | €584.189 | Euro | 2018 |
| Property tax A basic amount | €6.517 | Euro | 2018 |
| Property tax B basic amount | €41.020 | Euro | 2018 |
| Trade tax basic amount | €153.734 | Euro | 2018 |
| Property tax A rate | €340 | Euro | 2018 |
| Property tax B rate | €350 | Euro | 2018 |
| Trade tax rate | €380 | Euro | 2018 |
| Real tax raising force | €833.962 | Euro | 2018 |
| Trade tax levy | €104.997 | Euro | 2018 |
| Trade tax net | €479.192 | Euro | 2018 |
| Community share in income tax | €600.010 | Euro | 2018 |
| Community share in sales tax | €52.815 | Euro | 2018 |
| Tax revenue | €1.381.790 | Euro | 2018 |
| Regional | Value | Unit | Year |
|---|---|---|---|
| Region code | 010595919126 | Code | 2019 |
| Region code 8 digits | 01059126 | Code | 01059126 |
| Sorting code | 010595919126 | Code | 010595919126 |
| Sorting code 8 digits | 01059126 | Code | 01059126 |
| Region name | Hürup | Name | 2019 |
| Regional level | 6 | Categorical type | 2019 |
| Region type | Municipality | Categorical type | 2019 |
| Region type detail | municipality | Categorical type | 2019 |
| Region name with type | municipality Hürup | Name | 2019 |
| Region name in German | Gemeinde Hürup | Name | 2019 |
| Direct subregions | no data | Number | 2019 |
| NUTS code | DEF0C | Code | 2019 |
| Area | 16 | Area in km² | 2019 |
| Religion | Value | Unit | Year |
|---|---|---|---|
| Roman Catholic church | 41 | Number | 2011 |
| Protestant church | 877 | Number | 2011 |
| Other or none | 300 | Number | 2011 |
| % Roman Catholic church | 3% | Percentage | 2011 |
| % Protestant church | 72% | Percentage | 2011 |
| % Other or none | 25% | Percentage | 2011 |
| Roman Catholic church German | 41 | Number | 2011 |
| Protestant church German | 874 | Number | 2011 |
| Other or none German | 288 | Number | 2011 |
| % Roman Catholic church German | 3% | Percentage | 2011 |
| % Protestant church German | 73% | Percentage | 2011 |
| % Other or none German Foreign | 24% | Percentage | 2011 |
| Roman Catholic church Foreign | 0 | Number | 2011 |
| Protestant church Foreign | 3 | Number | 2011 |
| Other or none Foreign | 12 | Number | 2011 |
| % Roman Catholic church Foreign | 0% | Percentage | 2011 |
| % Protestant church Foreign | 20% | Percentage | 2011 |
| % Other or none Foreign | 80% | Percentage | 2011 |
Open data sources used
Data is used from multiple German open data providers. See this description of the sources with the definitions of all regional topics.
Sources & definitionsUnder development
Work is in progress to add more information to this page
This page will be further expanded with more topics in clear graphs. This will be done in several iterations in the coming weeks.