One moment please, your device is loading the charts...
Population numbers in the municipality Mellenbach-Glasbach for the years 2009 thru 2019.
The number of inhabitants is the number of persons as registered in the population register on January 1st.
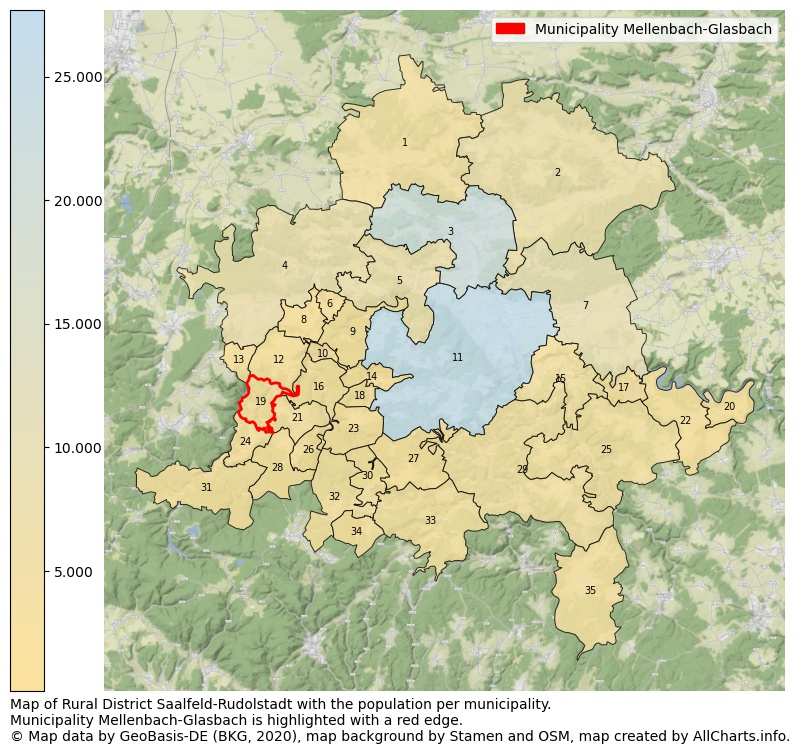
Map of Rural district Saalfeld-Rudolstadt with the population per municipality.Municipality Mellenbach-Glasbach is highlighted with a red edge. The numbers at the map represent the following municipalities: 1: municipality city Remda-Teichel, 2: municipality Uhlstädt-Kirchhasel, 3: municipality city Rudolstadt, 4: municipality city Königsee-Rottenbach, 5: municipality city Bad Blankenburg ...Show more... Map of Rural district Saalfeld-Rudolstadt with the population per municipality.Municipality Mellenbach-Glasbach is highlighted with a red edge. The numbers at the map represent the following municipalities: 1: municipality city Remda-Teichel, 2: municipality Uhlstädt-Kirchhasel, 3: municipality city Rudolstadt, 4: municipality city Königsee-Rottenbach, 5: municipality city Bad Blankenburg, 6: municipality Bechstedt, 7: municipality Unterwellenborn, 8: municipality Allendorf, 9: municipality Schwarzburg, 10: municipality Sitzendorf, 11: municipality city Saalfeld/Saale, 12: municipality Oberhain, 13: municipality Dröbischau, 14: municipality Döschnitz, 15: municipality Kaulsdorf, 16: municipality Unterweißbach, 17: municipality Hohenwarte, 18: municipality Rohrbach, 19: municipality Mellenbach-Glasbach, 20: municipality Altenbeuthen, 21: municipality city Oberweißbach/Thür. Wald, 22: municipality Drognitz, 23: municipality Meura, 24: municipality Meuselbach-Schwarzmühle, 25: municipality city Leutenberg, 26: municipality Deesbach, 27: municipality Reichmannsdorf, 28: municipality Cursdorf, 29: municipality Probstzella, 30: municipality Schmiedefeld, 31: municipality Katzhütte, 32: municipality Lichte, 33: municipality city Gräfenthal, 34: municipality Piesau, 35: municipality city Lehesten ...Show less...
One moment please, your device is loading the charts...
Municipality Mellenbach-Glasbach, 2019, number of rooms per house.
The percentage shows the relative share of houses per category based on the numer of rooms: 1 to 2 rooms, 3 to 4 rooms or 5 rooms or more. This is based on the total number of rooms as identified for all dwellings in the municipality Mellenbach-Glasbach.
The table below shows data for more than 100 topics as most recently available for the municipality Mellenbach-Glasbach. Select a category to display the related topics:
| Business | Value | Unit | Year |
|---|---|---|---|
| Businesses | 2 | Number | 2017 |
| Active persons | 0 | Number | 2017 |
| Gross wages | €0 | Euro | 2017 |
| Dwellings | Value | Unit | Year |
|---|---|---|---|
| Houses 1 room | 5 | Number | 2019 |
| Houses 2 rooms | 18 | Number | 2019 |
| Houses 3 rooms | 120 | Number | 2019 |
| Houses 4 rooms | 126 | Number | 2019 |
| Houses 5 rooms | 107 | Number | 2019 |
| Houses 6 rooms | 99 | Number | 2019 |
| Houses 7+ rooms | 87 | Number | 2019 |
| Houses 1-2 rooms | 23 | Number | 2019 |
| Houses 3-4 rooms | 246 | Number | 2019 |
| Houses 5+ rooms | 293 | Number | 2019 |
| 1-2 rooms | 4% | Percentage | 2019 |
| 3-4 rooms | 44% | Percentage | 2019 |
| 5+ rooms | 52% | Percentage | 2019 |
| Elections | Value | Unit | Year |
|---|---|---|---|
| Voters Bundestag | 831,00 | Number | 2017 |
| Voter turnout Bundestag | 66 | Number | 2017 |
| Votes valid Bundestag | 536 | Number | 2017 |
| Votes Bundestag CDU/CSU | 139 | Number | 2017 |
| Votes Bundestag SPD | 88 | Number | 2017 |
| Votes Bundestag GRÜNE | 5 | Number | 2017 |
| Votes Bundestag FDP | 36 | Number | 2017 |
| Votes Bundestag DIE LINKE | 102 | Number | 2017 |
| Votes Bundestag AfD | 140 | Number | 2017 |
| Votes Bundestag other parties | 26 | Number | 2017 |
| Votes Bundestag total | 536 | Number | 2017 |
| % Votes Bundestag CDU/CSU | 17% | Percentage | 2017 |
| % Votes Bundestag SPD | 11% | Percentage | 2017 |
| % Votes Bundestag GRÜNE | 1% | Percentage | 2017 |
| % Votes Bundestag FDP | 4% | Percentage | 2017 |
| % Votes Bundestag DIE LINKE | 12% | Percentage | 2017 |
| % Votes Bundestag AfD | 17% | Percentage | 2017 |
| % Votes Bundestag other parties | 3% | Percentage | 2017 |
| Employment | Value | Unit | Year |
|---|---|---|---|
| Employees | no data | Number | 2018 |
| Employees male | no data | Number | 2018 |
| Employees female | no data | Number | 2018 |
| Employees foreigner | no data | Number | 2018 |
| Employees male foreigner | no data | Number | 2018 |
| Employees female foreigner | no data | Number | 2018 |
| Unemployed | 24 | Number | 2018 |
| Unemployed foreigners | 0 | Number | 2018 |
| Unemployed severely disabled | 2 | Number | 2018 |
| Unemployed 15-20 | 0 | Number | 2018 |
| Unemployed 15-25 | 0 | Number | 2018 |
| Unemployed 55-65 | 9 | Number | 2018 |
| Unemployed long-term | 9 | Number | 2018 |
| % Unemployed | 3% | Percentage | 2018 |
| % Unemployed foreigners | 0% | Percentage of the population | 2018 |
| % Unemployed severely disabled | 0% | Percentage of the population | 2018 |
| % Unemployed 15-20 | 0% | Percentage of the population | 2018 |
| % Unemployed 15-25 | 0% | Percentage of the population | 2018 |
| % Unemployed 55-65 | 1% | Percentage of the population | 2018 |
| % Unemployed long-term | 1% | Percentage of the population | 2018 |
| Income | Value | Unit | Year |
|---|---|---|---|
| Income receivers | 402 | Number | 2015 |
| Income total | €11.207 | Euro | 2015 |
| Income tax | €1.302 | Euro | 2015 |
| Population | Value | Unit | Year |
|---|---|---|---|
| Population | 928 | Number | 2019 |
| Men | 467 | Number | 2019 |
| Women | 461 | Number | 2019 |
| % Men | 50% | Percentage | 2019 |
| % Women | 50% | Percentage | 2019 |
| 0-18 | 91 | Number | 2019 |
| 18-30 | 62 | Number | 2019 |
| 30-45 | 144 | Number | 2019 |
| 45-60 | 219 | Number | 2019 |
| 18-60 | 425 | Number | 2019 |
| 60-75 | 246 | Number | 2019 |
| 60+ | 412 | Number | 2019 |
| Average age | 53 | Average number | 2019 |
| Average age male | 50 | Average number | 2019 |
| Average age female | 56 | Average number | 2019 |
| Births | no data | Number | 2017 |
| Births male | no data | Number | 2017 |
| Births female | no data | Number | 2017 |
| 1K Births | no data | Number per 1000 inhabitants | 2017 |
| Deaths | 15 | Number | 2018 |
| Deaths male | 10 | Number | 2018 |
| Deaths female | 5 | Number | 2018 |
| 1K Deaths | 16 | Number | 2018 |
| 0-3 | 20 | Number | 2019 |
| Girls 0-3 | 10 | Number | 2019 |
| Boys 0-3 | 10 | Number | 2019 |
| 3-6 | 22 | Number | 2019 |
| Girls 3-6 | 8 | Number | 2019 |
| Boys 3-6 | 14 | Number | 2019 |
| 6-10 | 15 | Number | 2019 |
| 10-15 | 21 | Number | 2019 |
| 15-18 | 13 | Number | 2019 |
| 18-20 | 11 | Number | 2019 |
| 20-25 | 24 | Number | 2019 |
| 25-30 | 27 | Number | 2019 |
| 30-35 | 51 | Number | 2019 |
| 35-40 | 47 | Number | 2019 |
| 40-45 | 46 | Number | 2019 |
| 45-50 | 53 | Number | 2019 |
| 50-55 | 73 | Number | 2019 |
| 55-60 | 93 | Number | 2019 |
| 60-65 | 76 | Number | 2019 |
| 65-75 | 170 | Number | 2019 |
| Women 65-70 | 86 | Number | 2019 |
| Men 65-70 | 84 | Number | 2019 |
| 75+ | 166 | Number | 2019 |
| Women 75+ | 105 | Number | 2019 |
| Men 75+ | 61 | Number | 2019 |
| % 0-10 | 6% | Percentage | 2019 |
| % 10-18 | 4% | Percentage | 2019 |
| % 18-30 | 7% | Percentage | 2019 |
| % 30-45 | 16% | Percentage | 2019 |
| % 45-60 | 24% | Percentage | 2019 |
| % 60+ | 44% | Percentage | 2019 |
| Real estate | Value | Unit | Year |
|---|---|---|---|
| Property tax A revenue | no data | Euro | no data |
| Property tax B revenue | no data | Euro | no data |
| Trade tax actual revenue | no data | Euro | no data |
| Property tax A basic amount | no data | Euro | no data |
| Property tax B basic amount | no data | Euro | no data |
| Trade tax basic amount | no data | Euro | no data |
| Property tax A rate | no data | Euro | no data |
| Property tax B rate | no data | Euro | no data |
| Trade tax rate | no data | Euro | no data |
| Real tax raising force | no data | Euro | no data |
| Trade tax levy | no data | Euro | no data |
| Trade tax net | no data | Euro | no data |
| Community share in income tax | no data | Euro | no data |
| Community share in sales tax | no data | Euro | no data |
| Tax revenue | no data | Euro | no data |
| Regional | Value | Unit | Year |
|---|---|---|---|
| Region code | 160735003054 | Code | 2019 |
| Region code 8 digits | 16073054 | Code | 16073054 |
| Sorting code | 160735003054 | Code | 160735003054 |
| Sorting code 8 digits | 16073054 | Code | 16073054 |
| Region name | Mellenbach-Glasbach | Name | 2019 |
| Regional level | 6 | Categorical type | 2019 |
| Region type | Municipality | Categorical type | 2019 |
| Region type detail | municipality | Categorical type | 2019 |
| Region name with type | municipality Mellenbach-Glasbach | Name | 2019 |
| Region name in German | Gemeinde Mellenbach-Glasbach | Name | 2019 |
| Direct subregions | no data | Number | 2019 |
| NUTS code | DEG0I | Code | 2019 |
| Area | 9 | Area in km² | 2019 |
| Religion | Value | Unit | Year |
|---|---|---|---|
| Roman Catholic church | 30 | Number | 2011 |
| Protestant church | 270 | Number | 2011 |
| Other or none | 744 | Number | 2011 |
| % Roman Catholic church | 3% | Percentage | 2011 |
| % Protestant church | 26% | Percentage | 2011 |
| % Other or none | 71% | Percentage | 2011 |
| Roman Catholic church German | 27 | Number | 2011 |
| Protestant church German | 270 | Number | 2011 |
| Other or none German | 735 | Number | 2011 |
| % Roman Catholic church German | 3% | Percentage | 2011 |
| % Protestant church German | 26% | Percentage | 2011 |
| % Other or none German Foreign | 71% | Percentage | 2011 |
| Roman Catholic church Foreign | 3 | Number | 2011 |
| Protestant church Foreign | 0 | Number | 2011 |
| Other or none Foreign | 9 | Number | 2011 |
| % Roman Catholic church Foreign | 25% | Percentage | 2011 |
| % Protestant church Foreign | 0% | Percentage | 2011 |
| % Other or none Foreign | 75% | Percentage | 2011 |
Data is used from multiple German open data providers. See this description of the sources with the definitions of all regional topics.
Sources & definitionsThis page will be further expanded with more topics in clear graphs. This will be done in several iterations in the coming weeks.
![]()
© Published:
 Contents and more information: