One moment please, your device is loading the charts...
Population numbers in the municipality Münstertal/Schwarzwald for the years 2009 thru 2019.
The number of inhabitants is the number of persons as registered in the population register on January 1st.
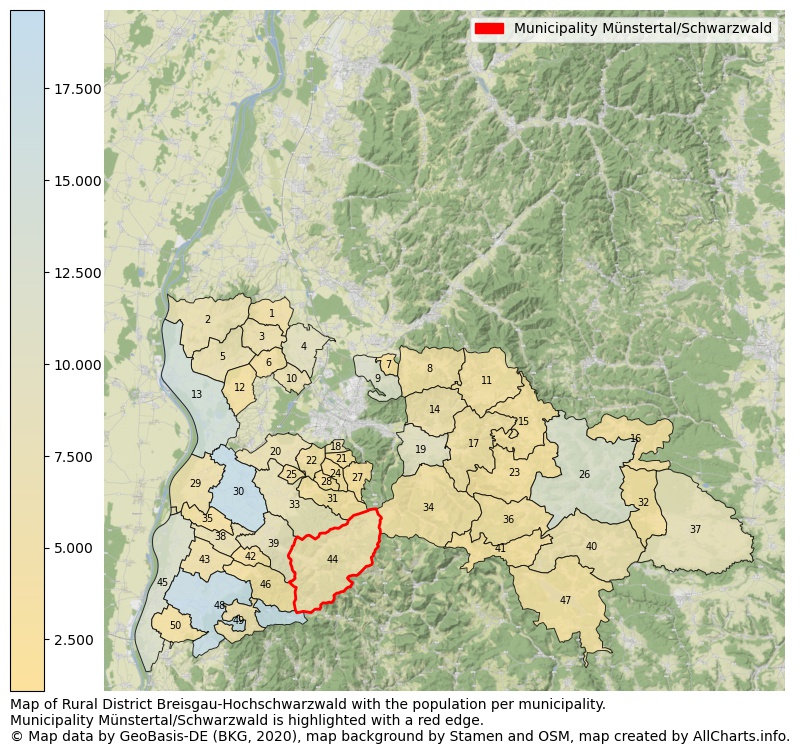
Map of Rural district Breisgau-Hochschwarzwald with the population per municipality.Municipality Münstertal/Schwarzwald is highlighted with a red edge. The numbers at the map represent the following municipalities: 1: municipality Eichstetten am Kaiserstuhl, 2: municipality city Vogtsburg im Kaiserstuhl, 3: municipality Bötzingen, 4: municipality March, 5: municipality Ihringen ...Show more... Map of Rural district Breisgau-Hochschwarzwald with the population per municipality.Municipality Münstertal/Schwarzwald is highlighted with a red edge. The numbers at the map represent the following municipalities: 1: municipality Eichstetten am Kaiserstuhl, 2: municipality city Vogtsburg im Kaiserstuhl, 3: municipality Bötzingen, 4: municipality March, 5: municipality Ihringen, 6: municipality Gottenheim, 7: municipality Heuweiler, 8: municipality Glottertal, 9: municipality Gundelfingen, 10: municipality Umkirch, 11: municipality St. Peter, 12: municipality Merdingen, 13: municipality city Breisach am Rhein, 14: municipality Stegen, 15: municipality St. Märgen, 16: municipality Eisenbach (Hochschwarzwald), 17: municipality Buchenbach, 18: municipality Merzhausen, 19: municipality Kirchzarten, 20: municipality Schallstadt, 21: municipality Au, 22: municipality Ebringen, 23: municipality Breitnau, 24: municipality Wittnau, 25: municipality Pfaffenweiler, 26: municipality city Titisee-Neustadt, 27: municipality Horben, 28: municipality Sölden, 29: municipality Hartheim am Rhein, 30: municipality city Bad Krozingen, 31: municipality Bollschweil, 32: municipality Friedenweiler, 33: municipality Ehrenkirchen, 34: municipality Oberried, 35: municipality Eschbach, 36: municipality Hinterzarten, 37: municipality city Löffingen, 38: municipality city Heitersheim, 39: municipality city Staufen im Breisgau, 40: municipality Lenzkirch, 41: municipality Feldberg (Schwarzwald), 42: municipality Ballrechten-Dottingen, 43: municipality Buggingen, 44: municipality Münstertal/Schwarzwald, 45: municipality city Neuenburg am Rhein, 46: municipality city Sulzburg, 47: municipality Schluchsee, 48: municipality city Müllheim, 49: municipality Badenweiler, 50: municipality Auggen ...Show less...
One moment please, your device is loading the charts...
Municipality Münstertal/Schwarzwald, 2019, number of rooms per house.
The percentage shows the relative share of houses per category based on the numer of rooms: 1 to 2 rooms, 3 to 4 rooms or 5 rooms or more. This is based on the total number of rooms as identified for all dwellings in the municipality Münstertal/Schwarzwald.
The table below shows data for more than 100 topics as most recently available for the municipality Münstertal/Schwarzwald. Select a category to display the related topics:
| Business | Value | Unit | Year |
|---|---|---|---|
| Businesses | 4 | Number | 2017 |
| Active persons | 151 | Number | 2017 |
| Gross wages | €3.192 | Euro | 2017 |
| Dwellings | Value | Unit | Year |
|---|---|---|---|
| Houses 1 room | 42 | Number | 2019 |
| Houses 2 rooms | 197 | Number | 2019 |
| Houses 3 rooms | 439 | Number | 2019 |
| Houses 4 rooms | 638 | Number | 2019 |
| Houses 5 rooms | 434 | Number | 2019 |
| Houses 6 rooms | 284 | Number | 2019 |
| Houses 7+ rooms | 367 | Number | 2019 |
| Houses 1-2 rooms | 239 | Number | 2019 |
| Houses 3-4 rooms | 1.077 | Number | 2019 |
| Houses 5+ rooms | 1.085 | Number | 2019 |
| 1-2 rooms | 10% | Percentage | 2019 |
| 3-4 rooms | 45% | Percentage | 2019 |
| 5+ rooms | 45% | Percentage | 2019 |
| Elections | Value | Unit | Year |
|---|---|---|---|
| Voters Bundestag | 3890,00 | Number | 2017 |
| Voter turnout Bundestag | 78 | Number | 2017 |
| Votes valid Bundestag | 2.201 | Number | 2017 |
| Votes Bundestag CDU/CSU | 920 | Number | 2017 |
| Votes Bundestag SPD | 435 | Number | 2017 |
| Votes Bundestag GRÜNE | 295 | Number | 2017 |
| Votes Bundestag FDP | 197 | Number | 2017 |
| Votes Bundestag DIE LINKE | 109 | Number | 2017 |
| Votes Bundestag AfD | 164 | Number | 2017 |
| Votes Bundestag other parties | 81 | Number | 2017 |
| Votes Bundestag total | 2.201 | Number | 2017 |
| % Votes Bundestag CDU/CSU | 24% | Percentage | 2017 |
| % Votes Bundestag SPD | 11% | Percentage | 2017 |
| % Votes Bundestag GRÜNE | 8% | Percentage | 2017 |
| % Votes Bundestag FDP | 5% | Percentage | 2017 |
| % Votes Bundestag DIE LINKE | 3% | Percentage | 2017 |
| % Votes Bundestag AfD | 4% | Percentage | 2017 |
| % Votes Bundestag other parties | 2% | Percentage | 2017 |
| Employment | Value | Unit | Year |
|---|---|---|---|
| Employees | 2.129 | Number | 2019 |
| Employees male | 1.137 | Number | 2019 |
| Employees female | 992 | Number | 2019 |
| Employees foreigner | 252 | Number | 2019 |
| Employees male foreigner | 141 | Number | 2019 |
| Employees female foreigner | 111 | Number | 2019 |
| Unemployed | 58 | Number | 2018 |
| Unemployed foreigners | 18 | Number | 2018 |
| Unemployed severely disabled | 7 | Number | 2018 |
| Unemployed 15-20 | 1 | Number | 2018 |
| Unemployed 15-25 | 7 | Number | 2018 |
| Unemployed 55-65 | 14 | Number | 2018 |
| Unemployed long-term | 10 | Number | 2018 |
| % Unemployed | 1% | Percentage | 2018 |
| % Unemployed foreigners | 0% | Percentage of the population | 2018 |
| % Unemployed severely disabled | 0% | Percentage of the population | 2018 |
| % Unemployed 15-20 | 0% | Percentage of the population | 2018 |
| % Unemployed 15-25 | 0% | Percentage of the population | 2018 |
| % Unemployed 55-65 | 0% | Percentage of the population | 2018 |
| % Unemployed long-term | 0% | Percentage of the population | 2018 |
| Income | Value | Unit | Year |
|---|---|---|---|
| Income receivers | 2.550 | Number | 2015 |
| Income total | €89.662 | Euro | 2015 |
| Income tax | €13.926 | Euro | 2015 |
| Population | Value | Unit | Year |
|---|---|---|---|
| Population | 5.110 | Number | 2019 |
| Men | 2.541 | Number | 2019 |
| Women | 2.569 | Number | 2019 |
| % Men | 50% | Percentage | 2019 |
| % Women | 50% | Percentage | 2019 |
| 0-18 | 812 | Number | 2019 |
| 18-30 | 772 | Number | 2019 |
| 30-45 | 818 | Number | 2019 |
| 45-60 | 1.243 | Number | 2019 |
| 18-60 | 2.833 | Number | 2019 |
| 60-75 | 848 | Number | 2019 |
| 60+ | 1.465 | Number | 2019 |
| Average age | 45 | Average number | 2019 |
| Average age male | 44 | Average number | 2019 |
| Average age female | 46 | Average number | 2019 |
| Births | 28 | Number | 2018 |
| Births male | 13 | Number | 2018 |
| Births female | 15 | Number | 2018 |
| 1K Births | 5 | Number per 1000 inhabitants | 2018 |
| Deaths | 36 | Number | 2018 |
| Deaths male | 24 | Number | 2018 |
| Deaths female | 12 | Number | 2018 |
| 1K Deaths | 7 | Number | 2018 |
| 0-3 | 117 | Number | 2019 |
| Girls 0-3 | 65 | Number | 2019 |
| Boys 0-3 | 52 | Number | 2019 |
| 3-6 | 116 | Number | 2019 |
| Girls 3-6 | 64 | Number | 2019 |
| Boys 3-6 | 52 | Number | 2019 |
| 6-10 | 173 | Number | 2019 |
| 10-15 | 239 | Number | 2019 |
| 15-18 | 167 | Number | 2019 |
| 18-20 | 121 | Number | 2019 |
| 20-25 | 341 | Number | 2019 |
| 25-30 | 310 | Number | 2019 |
| 30-35 | 274 | Number | 2019 |
| 35-40 | 275 | Number | 2019 |
| 40-45 | 269 | Number | 2019 |
| 45-50 | 318 | Number | 2019 |
| 50-55 | 462 | Number | 2019 |
| 55-60 | 463 | Number | 2019 |
| 60-65 | 351 | Number | 2019 |
| 65-75 | 497 | Number | 2019 |
| Women 65-70 | 246 | Number | 2019 |
| Men 65-70 | 251 | Number | 2019 |
| 75+ | 617 | Number | 2019 |
| Women 75+ | 362 | Number | 2019 |
| Men 75+ | 255 | Number | 2019 |
| % 0-10 | 8% | Percentage | 2019 |
| % 10-18 | 8% | Percentage | 2019 |
| % 18-30 | 15% | Percentage | 2019 |
| % 30-45 | 16% | Percentage | 2019 |
| % 45-60 | 24% | Percentage | 2019 |
| % 60+ | 29% | Percentage | 2019 |
| Real estate | Value | Unit | Year |
|---|---|---|---|
| Property tax A revenue | no data | Euro | no data |
| Property tax B revenue | no data | Euro | no data |
| Trade tax actual revenue | no data | Euro | no data |
| Property tax A basic amount | no data | Euro | no data |
| Property tax B basic amount | no data | Euro | no data |
| Trade tax basic amount | no data | Euro | no data |
| Property tax A rate | no data | Euro | no data |
| Property tax B rate | no data | Euro | no data |
| Trade tax rate | no data | Euro | no data |
| Real tax raising force | no data | Euro | no data |
| Trade tax levy | no data | Euro | no data |
| Trade tax net | no data | Euro | no data |
| Community share in income tax | no data | Euro | no data |
| Community share in sales tax | no data | Euro | no data |
| Tax revenue | no data | Euro | no data |
| Regional | Value | Unit | Year |
|---|---|---|---|
| Region code | 083155016130 | Code | 2019 |
| Region code 8 digits | 08315130 | Code | 08315130 |
| Sorting code | 083155016130 | Code | 083155016130 |
| Sorting code 8 digits | 08315130 | Code | 08315130 |
| Region name | Münstertal/Schwarzwald | Name | 2019 |
| Regional level | 6 | Categorical type | 2019 |
| Region type | Municipality | Categorical type | 2019 |
| Region type detail | municipality | Categorical type | 2019 |
| Region name with type | municipality Münstertal/Schwarzwald | Name | 2019 |
| Region name in German | Gemeinde Münstertal/Schwarzwald | Name | 2019 |
| Direct subregions | no data | Number | 2019 |
| NUTS code | DE132 | Code | 2019 |
| Area | 68 | Area in km² | 2019 |
| Religion | Value | Unit | Year |
|---|---|---|---|
| Roman Catholic church | 3.528 | Number | 2011 |
| Protestant church | 670 | Number | 2011 |
| Other or none | 848 | Number | 2011 |
| % Roman Catholic church | 70% | Percentage | 2011 |
| % Protestant church | 13% | Percentage | 2011 |
| % Other or none | 17% | Percentage | 2011 |
| Roman Catholic church German | 3.450 | Number | 2011 |
| Protestant church German | 667 | Number | 2011 |
| Other or none German | 705 | Number | 2011 |
| % Roman Catholic church German | 72% | Percentage | 2011 |
| % Protestant church German | 14% | Percentage | 2011 |
| % Other or none German Foreign | 15% | Percentage | 2011 |
| Roman Catholic church Foreign | 78 | Number | 2011 |
| Protestant church Foreign | 3 | Number | 2011 |
| Other or none Foreign | 143 | Number | 2011 |
| % Roman Catholic church Foreign | 35% | Percentage | 2011 |
| % Protestant church Foreign | 1% | Percentage | 2011 |
| % Other or none Foreign | 64% | Percentage | 2011 |
Data is used from multiple German open data providers. See this description of the sources with the definitions of all regional topics.
Sources & definitionsThis page will be further expanded with more topics in clear graphs. This will be done in several iterations in the coming weeks.
![]()
© Published:
 Contents and more information: