One moment please, your device is loading the charts...
Population numbers in the municipality Neu-Seeland for the years 2009 thru 2019.
The number of inhabitants is the number of persons as registered in the population register on January 1st.
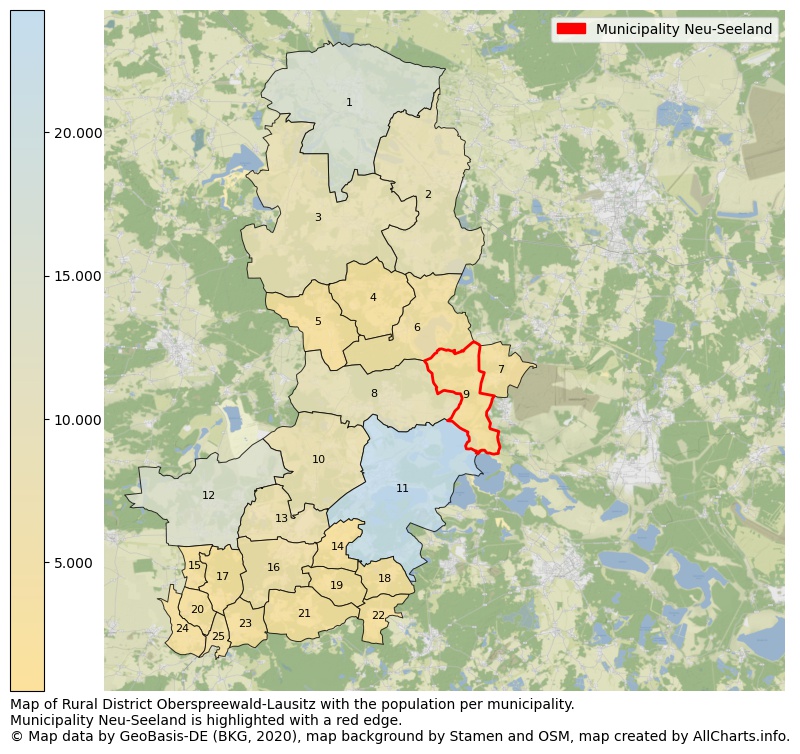
Map of Rural district Oberspreewald-Lausitz with the population per municipality.Municipality Neu-Seeland is highlighted with a red edge. The numbers at the map represent the following municipalities: 1: municipality city Lübbenau/Spreewald, 2: municipality city Vetschau/Spreewald, 3: municipality city Calau, 4: municipality Luckaitztal, 5: municipality Bronkow ...Show more... Map of Rural district Oberspreewald-Lausitz with the population per municipality.Municipality Neu-Seeland is highlighted with a red edge. The numbers at the map represent the following municipalities: 1: municipality city Lübbenau/Spreewald, 2: municipality city Vetschau/Spreewald, 3: municipality city Calau, 4: municipality Luckaitztal, 5: municipality Bronkow, 6: municipality Altdöbern, 7: municipality Neupetershain, 8: municipality city Großräschen, 9: municipality Neu-Seeland, 10: municipality Schipkau, 11: municipality city Senftenberg, 12: municipality city Lauchhammer, 13: municipality city Schwarzheide, 14: municipality Schwarzbach, 15: municipality Tettau, 16: municipality city Ruhland, 17: municipality Frauendorf, 18: municipality Hohenbocka, 19: municipality Guteborn, 20: municipality Lindenau, 21: municipality Hermsdorf, 22: municipality Grünewald, 23: municipality Kroppen, 24: municipality Großkmehlen, 25: municipality city Ortrand ...Show less...
One moment please, your device is loading the charts...
Municipality Neu-Seeland, 2019, number of rooms per house.
The percentage shows the relative share of houses per category based on the numer of rooms: 1 to 2 rooms, 3 to 4 rooms or 5 rooms or more. This is based on the total number of rooms as identified for all dwellings in the municipality Neu-Seeland.
The table below shows data for more than 100 topics as most recently available for the municipality Neu-Seeland. Select a category to display the related topics:
| Business | Value | Unit | Year |
|---|---|---|---|
| Businesses | no data | Number | 2015 |
| Active persons | no data | Number | 2015 |
| Gross wages | no data | Euro | 2015 |
| Dwellings | Value | Unit | Year |
|---|---|---|---|
| Houses 1 room | 0 | Number | 2019 |
| Houses 2 rooms | 8 | Number | 2019 |
| Houses 3 rooms | 60 | Number | 2019 |
| Houses 4 rooms | 86 | Number | 2019 |
| Houses 5 rooms | 79 | Number | 2019 |
| Houses 6 rooms | 47 | Number | 2019 |
| Houses 7+ rooms | 39 | Number | 2019 |
| Houses 1-2 rooms | 8 | Number | 2019 |
| Houses 3-4 rooms | 146 | Number | 2019 |
| Houses 5+ rooms | 165 | Number | 2019 |
| 1-2 rooms | 3% | Percentage | 2019 |
| 3-4 rooms | 46% | Percentage | 2019 |
| 5+ rooms | 52% | Percentage | 2019 |
| Elections | Value | Unit | Year |
|---|---|---|---|
| Voters Bundestag | 513,00 | Number | 2017 |
| Voter turnout Bundestag | 74 | Number | 2017 |
| Votes valid Bundestag | 370 | Number | 2017 |
| Votes Bundestag CDU/CSU | 103 | Number | 2017 |
| Votes Bundestag SPD | 59 | Number | 2017 |
| Votes Bundestag GRÜNE | 14 | Number | 2017 |
| Votes Bundestag FDP | 19 | Number | 2017 |
| Votes Bundestag DIE LINKE | 64 | Number | 2017 |
| Votes Bundestag AfD | 84 | Number | 2017 |
| Votes Bundestag other parties | 27 | Number | 2017 |
| Votes Bundestag total | 370 | Number | 2017 |
| % Votes Bundestag CDU/CSU | 20% | Percentage | 2017 |
| % Votes Bundestag SPD | 12% | Percentage | 2017 |
| % Votes Bundestag GRÜNE | 3% | Percentage | 2017 |
| % Votes Bundestag FDP | 4% | Percentage | 2017 |
| % Votes Bundestag DIE LINKE | 12% | Percentage | 2017 |
| % Votes Bundestag AfD | 16% | Percentage | 2017 |
| % Votes Bundestag other parties | 5% | Percentage | 2017 |
| Employment | Value | Unit | Year |
|---|---|---|---|
| Employees | 247 | Number | 2019 |
| Employees male | 140 | Number | 2019 |
| Employees female | 107 | Number | 2019 |
| Employees foreigner | 0 | Number | 2019 |
| Employees male foreigner | 0 | Number | 2019 |
| Employees female foreigner | 0 | Number | 2019 |
| Unemployed | 15 | Number | 2018 |
| Unemployed foreigners | 0 | Number | 2018 |
| Unemployed severely disabled | 1 | Number | 2018 |
| Unemployed 15-20 | 0 | Number | 2018 |
| Unemployed 15-25 | 0 | Number | 2018 |
| Unemployed 55-65 | 3 | Number | 2018 |
| Unemployed long-term | 3 | Number | 2018 |
| % Unemployed | 2% | Percentage | 2018 |
| % Unemployed foreigners | 0% | Percentage of the population | 2018 |
| % Unemployed severely disabled | 0% | Percentage of the population | 2018 |
| % Unemployed 15-20 | 0% | Percentage of the population | 2018 |
| % Unemployed 15-25 | 0% | Percentage of the population | 2018 |
| % Unemployed 55-65 | 0% | Percentage of the population | 2018 |
| % Unemployed long-term | 0% | Percentage of the population | 2018 |
| Income | Value | Unit | Year |
|---|---|---|---|
| Income receivers | 252 | Number | 2015 |
| Income total | €7.695 | Euro | 2015 |
| Income tax | €1.023 | Euro | 2015 |
| Population | Value | Unit | Year |
|---|---|---|---|
| Population | 600 | Number | 2019 |
| Men | 297 | Number | 2019 |
| Women | 303 | Number | 2019 |
| % Men | 50% | Percentage | 2019 |
| % Women | 50% | Percentage | 2019 |
| 0-18 | 88 | Number | 2019 |
| 18-30 | 34 | Number | 2019 |
| 30-45 | 97 | Number | 2019 |
| 45-60 | 165 | Number | 2019 |
| 18-60 | 296 | Number | 2019 |
| 60-75 | 128 | Number | 2019 |
| 60+ | 216 | Number | 2019 |
| Average age | 49 | Average number | 2019 |
| Average age male | 48 | Average number | 2019 |
| Average age female | 50 | Average number | 2019 |
| Births | 4 | Number | 2018 |
| Births male | 1 | Number | 2018 |
| Births female | 3 | Number | 2018 |
| 1K Births | 7 | Number per 1000 inhabitants | 2018 |
| Deaths | 11 | Number | 2018 |
| Deaths male | 5 | Number | 2018 |
| Deaths female | 6 | Number | 2018 |
| 1K Deaths | 19 | Number | 2018 |
| 0-3 | 23 | Number | 2019 |
| Girls 0-3 | 15 | Number | 2019 |
| Boys 0-3 | 8 | Number | 2019 |
| 3-6 | 14 | Number | 2019 |
| Girls 3-6 | 9 | Number | 2019 |
| Boys 3-6 | 5 | Number | 2019 |
| 6-10 | 11 | Number | 2019 |
| 10-15 | 25 | Number | 2019 |
| 15-18 | 15 | Number | 2019 |
| 18-20 | 11 | Number | 2019 |
| 20-25 | 12 | Number | 2019 |
| 25-30 | 11 | Number | 2019 |
| 30-35 | 34 | Number | 2019 |
| 35-40 | 32 | Number | 2019 |
| 40-45 | 31 | Number | 2019 |
| 45-50 | 51 | Number | 2019 |
| 50-55 | 47 | Number | 2019 |
| 55-60 | 67 | Number | 2019 |
| 60-65 | 56 | Number | 2019 |
| 65-75 | 72 | Number | 2019 |
| Women 65-70 | 41 | Number | 2019 |
| Men 65-70 | 31 | Number | 2019 |
| 75+ | 88 | Number | 2019 |
| Women 75+ | 52 | Number | 2019 |
| Men 75+ | 36 | Number | 2019 |
| % 0-10 | 8% | Percentage | 2019 |
| % 10-18 | 7% | Percentage | 2019 |
| % 18-30 | 6% | Percentage | 2019 |
| % 30-45 | 16% | Percentage | 2019 |
| % 45-60 | 28% | Percentage | 2019 |
| % 60+ | 36% | Percentage | 2019 |
| Real estate | Value | Unit | Year |
|---|---|---|---|
| Property tax A revenue | no data | Euro | no data |
| Property tax B revenue | no data | Euro | no data |
| Trade tax actual revenue | no data | Euro | no data |
| Property tax A basic amount | no data | Euro | no data |
| Property tax B basic amount | no data | Euro | no data |
| Trade tax basic amount | no data | Euro | no data |
| Property tax A rate | no data | Euro | no data |
| Property tax B rate | no data | Euro | no data |
| Trade tax rate | no data | Euro | no data |
| Real tax raising force | no data | Euro | no data |
| Trade tax levy | no data | Euro | no data |
| Trade tax net | no data | Euro | no data |
| Community share in income tax | no data | Euro | no data |
| Community share in sales tax | no data | Euro | no data |
| Tax revenue | no data | Euro | no data |
| Regional | Value | Unit | Year |
|---|---|---|---|
| Region code | 120665601226 | Code | 2019 |
| Region code 8 digits | 12066226 | Code | 12066226 |
| Sorting code | 120665601226 | Code | 120665601226 |
| Sorting code 8 digits | 12066226 | Code | 12066226 |
| Region name | Neu-Seeland | Name | 2019 |
| Regional level | 6 | Categorical type | 2019 |
| Region type | Municipality | Categorical type | 2019 |
| Region type detail | municipality | Categorical type | 2019 |
| Region name with type | municipality Neu-Seeland | Name | 2019 |
| Region name in German | Gemeinde Neu-Seeland | Name | 2019 |
| Direct subregions | no data | Number | 2019 |
| NUTS code | DE40B | Code | 2019 |
| Area | 38 | Area in km² | 2019 |
| Religion | Value | Unit | Year |
|---|---|---|---|
| Roman Catholic church | 6 | Number | 2011 |
| Protestant church | 209 | Number | 2011 |
| Other or none | 426 | Number | 2011 |
| % Roman Catholic church | 1% | Percentage | 2011 |
| % Protestant church | 33% | Percentage | 2011 |
| % Other or none | 66% | Percentage | 2011 |
| Roman Catholic church German | 6 | Number | 2011 |
| Protestant church German | 209 | Number | 2011 |
| Other or none German | 423 | Number | 2011 |
| % Roman Catholic church German | 1% | Percentage | 2011 |
| % Protestant church German | 33% | Percentage | 2011 |
| % Other or none German Foreign | 66% | Percentage | 2011 |
| Roman Catholic church Foreign | 0 | Number | 2011 |
| Protestant church Foreign | 0 | Number | 2011 |
| Other or none Foreign | 3 | Number | 2011 |
| % Roman Catholic church Foreign | 0% | Percentage | 2011 |
| % Protestant church Foreign | 0% | Percentage | 2011 |
| % Other or none Foreign | 100% | Percentage | 2011 |
Data is used from multiple German open data providers. See this description of the sources with the definitions of all regional topics.
Sources & definitionsThis page will be further expanded with more topics in clear graphs. This will be done in several iterations in the coming weeks.
![]()
© Published:
 Contents and more information: