One moment please, your device is loading the charts...
Population numbers in the municipality Neukirchen b. Sulzbach-Rosenberg for the years 2009 thru 2019.
The number of inhabitants is the number of persons as registered in the population register on January 1st.
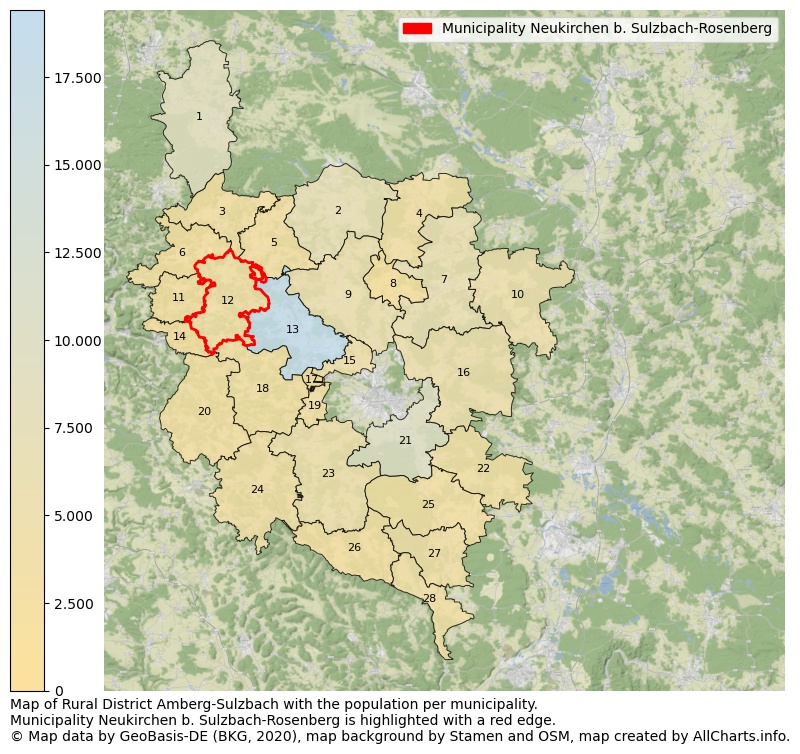
Map of Rural district Amberg-Sulzbach with the population per municipality.Municipality Neukirchen b. Sulzbach-Rosenberg is highlighted with a red edge. The numbers at the map represent the following municipalities: 1: municipality city Auerbach i.d. OPf., 2: municipality city Vilseck, 3: municipality Königstein, 4: municipality Freihung, 5: municipality Edelsfeld ...Show more... Map of Rural district Amberg-Sulzbach with the population per municipality.Municipality Neukirchen b. Sulzbach-Rosenberg is highlighted with a red edge. The numbers at the map represent the following municipalities: 1: municipality city Auerbach i.d. OPf., 2: municipality city Vilseck, 3: municipality Königstein, 4: municipality Freihung, 5: municipality Edelsfeld, 6: municipality Hirschbach, 7: municipality city Hirschau, 8: municipality Gebenbach, 9: municipality Hahnbach, 10: municipality city Schnaittenbach, 11: municipality Etzelwang, 12: municipality Neukirchen b. Sulzbach-Rosenberg, 13: municipality city Sulzbach-Rosenberg, 14: municipality Weigendorf, 15: municipality Poppenricht, 16: municipality Freudenberg, 17: unincorporated area Eichen, 18: municipality Illschwang, 19: municipality Ammerthal, 20: municipality Birgland, 21: municipality Kümmersbruck, 22: municipality Ebermannsdorf, 23: municipality Ursensollen, 24: municipality Kastl, 25: municipality Ensdorf, 26: municipality Hohenburg, 27: municipality Rieden, 28: municipality Schmidmühlen ...Show less...
One moment please, your device is loading the charts...
Municipality Neukirchen b. Sulzbach-Rosenberg, 2019, age groups.
Population, age groups: percentage of inhabitants per age category.
One moment please, your device is loading the charts...
Municipality Neukirchen b. Sulzbach-Rosenberg, 2019, number of rooms per house.
The percentage shows the relative share of houses per category based on the numer of rooms: 1 to 2 rooms, 3 to 4 rooms or 5 rooms or more. This is based on the total number of rooms as identified for all dwellings in the municipality Neukirchen b. Sulzbach-Rosenberg.
The table below shows data for more than 100 topics as most recently available for the municipality Neukirchen b. Sulzbach-Rosenberg. Select a category to display the related topics:
| Business | Value | Unit | Year |
|---|---|---|---|
| Businesses | 1 | Number | 2017 |
| Active persons | 0 | Number | 2017 |
| Gross wages | €0 | Euro | 2017 |
| Dwellings | Value | Unit | Year |
|---|---|---|---|
| Houses 1 room | 3 | Number | 2019 |
| Houses 2 rooms | 51 | Number | 2019 |
| Houses 3 rooms | 113 | Number | 2019 |
| Houses 4 rooms | 249 | Number | 2019 |
| Houses 5 rooms | 248 | Number | 2019 |
| Houses 6 rooms | 200 | Number | 2019 |
| Houses 7+ rooms | 326 | Number | 2019 |
| Houses 1-2 rooms | 54 | Number | 2019 |
| Houses 3-4 rooms | 362 | Number | 2019 |
| Houses 5+ rooms | 774 | Number | 2019 |
| 1-2 rooms | 5% | Percentage | 2019 |
| 3-4 rooms | 30% | Percentage | 2019 |
| 5+ rooms | 65% | Percentage | 2019 |
| Elections | Value | Unit | Year |
|---|---|---|---|
| Voters Bundestag | 2011,00 | Number | 2017 |
| Voter turnout Bundestag | 84 | Number | 2017 |
| Votes valid Bundestag | 1.663 | Number | 2017 |
| Votes Bundestag CDU/CSU | 647 | Number | 2017 |
| Votes Bundestag SPD | 308 | Number | 2017 |
| Votes Bundestag GRÜNE | 136 | Number | 2017 |
| Votes Bundestag FDP | 127 | Number | 2017 |
| Votes Bundestag DIE LINKE | 112 | Number | 2017 |
| Votes Bundestag AfD | 173 | Number | 2017 |
| Votes Bundestag other parties | 160 | Number | 2017 |
| Votes Bundestag total | 1.663 | Number | 2017 |
| % Votes Bundestag CDU/CSU | 32% | Percentage | 2017 |
| % Votes Bundestag SPD | 15% | Percentage | 2017 |
| % Votes Bundestag GRÜNE | 7% | Percentage | 2017 |
| % Votes Bundestag FDP | 6% | Percentage | 2017 |
| % Votes Bundestag DIE LINKE | 6% | Percentage | 2017 |
| % Votes Bundestag AfD | 9% | Percentage | 2017 |
| % Votes Bundestag other parties | 8% | Percentage | 2017 |
| Employment | Value | Unit | Year |
|---|---|---|---|
| Employees | 995 | Number | 2019 |
| Employees male | 555 | Number | 2019 |
| Employees female | 440 | Number | 2019 |
| Employees foreigner | 33 | Number | 2019 |
| Employees male foreigner | 20 | Number | 2019 |
| Employees female foreigner | 13 | Number | 2019 |
| Unemployed | 42 | Number | 2018 |
| Unemployed foreigners | 3 | Number | 2018 |
| Unemployed severely disabled | 5 | Number | 2018 |
| Unemployed 15-20 | 1 | Number | 2018 |
| Unemployed 15-25 | 3 | Number | 2018 |
| Unemployed 55-65 | 13 | Number | 2018 |
| Unemployed long-term | 12 | Number | 2018 |
| % Unemployed | 2% | Percentage | 2018 |
| % Unemployed foreigners | 0% | Percentage of the population | 2018 |
| % Unemployed severely disabled | 0% | Percentage of the population | 2018 |
| % Unemployed 15-20 | 0% | Percentage of the population | 2018 |
| % Unemployed 15-25 | 0% | Percentage of the population | 2018 |
| % Unemployed 55-65 | 1% | Percentage of the population | 2018 |
| % Unemployed long-term | 0% | Percentage of the population | 2018 |
| Income | Value | Unit | Year |
|---|---|---|---|
| Income receivers | 1.246 | Number | 2015 |
| Income total | €43.425 | Euro | 2015 |
| Income tax | €6.316 | Euro | 2015 |
| Population | Value | Unit | Year |
|---|---|---|---|
| Population | 2.483 | Number | 2019 |
| Men | 1.265 | Number | 2019 |
| Women | 1.218 | Number | 2019 |
| % Men | 51% | Percentage | 2019 |
| % Women | 49% | Percentage | 2019 |
| 0-18 | 382 | Number | 2019 |
| 18-30 | 299 | Number | 2019 |
| 30-45 | 361 | Number | 2019 |
| 45-60 | 670 | Number | 2019 |
| 18-60 | 1.330 | Number | 2019 |
| 60-75 | 466 | Number | 2019 |
| 60+ | 771 | Number | 2019 |
| Average age | 47 | Average number | 2019 |
| Average age male | 46 | Average number | 2019 |
| Average age female | 48 | Average number | 2019 |
| Births | 22 | Number | 2018 |
| Births male | 8 | Number | 2018 |
| Births female | 14 | Number | 2018 |
| 1K Births | 9 | Number per 1000 inhabitants | 2018 |
| Deaths | 37 | Number | 2018 |
| Deaths male | 24 | Number | 2018 |
| Deaths female | 13 | Number | 2018 |
| 1K Deaths | 15 | Number | 2018 |
| 0-3 | 61 | Number | 2019 |
| Girls 0-3 | 32 | Number | 2019 |
| Boys 0-3 | 29 | Number | 2019 |
| 3-6 | 60 | Number | 2019 |
| Girls 3-6 | 29 | Number | 2019 |
| Boys 3-6 | 31 | Number | 2019 |
| 6-10 | 68 | Number | 2019 |
| 10-15 | 105 | Number | 2019 |
| 15-18 | 88 | Number | 2019 |
| 18-20 | 54 | Number | 2019 |
| 20-25 | 117 | Number | 2019 |
| 25-30 | 128 | Number | 2019 |
| 30-35 | 112 | Number | 2019 |
| 35-40 | 129 | Number | 2019 |
| 40-45 | 120 | Number | 2019 |
| 45-50 | 179 | Number | 2019 |
| 50-55 | 206 | Number | 2019 |
| 55-60 | 285 | Number | 2019 |
| 60-65 | 187 | Number | 2019 |
| 65-75 | 279 | Number | 2019 |
| Women 65-70 | 145 | Number | 2019 |
| Men 65-70 | 134 | Number | 2019 |
| 75+ | 305 | Number | 2019 |
| Women 75+ | 173 | Number | 2019 |
| Men 75+ | 132 | Number | 2019 |
| % 0-10 | 8% | Percentage | 2019 |
| % 10-18 | 8% | Percentage | 2019 |
| % 18-30 | 12% | Percentage | 2019 |
| % 30-45 | 15% | Percentage | 2019 |
| % 45-60 | 27% | Percentage | 2019 |
| % 60+ | 31% | Percentage | 2019 |
| Real estate | Value | Unit | Year |
|---|---|---|---|
| Property tax A revenue | no data | Euro | no data |
| Property tax B revenue | no data | Euro | no data |
| Trade tax actual revenue | no data | Euro | no data |
| Property tax A basic amount | no data | Euro | no data |
| Property tax B basic amount | no data | Euro | no data |
| Trade tax basic amount | no data | Euro | no data |
| Property tax A rate | no data | Euro | no data |
| Property tax B rate | no data | Euro | no data |
| Trade tax rate | no data | Euro | no data |
| Real tax raising force | no data | Euro | no data |
| Trade tax levy | no data | Euro | no data |
| Trade tax net | no data | Euro | no data |
| Community share in income tax | no data | Euro | no data |
| Community share in sales tax | no data | Euro | no data |
| Tax revenue | no data | Euro | no data |
| Regional | Value | Unit | Year |
|---|---|---|---|
| Region code | 093715303141 | Code | 2019 |
| Region code 8 digits | 09371141 | Code | 09371141 |
| Sorting code | 093715303141 | Code | 093715303141 |
| Sorting code 8 digits | 09371141 | Code | 09371141 |
| Region name | Neukirchen b. Sulzbach-Rosenberg | Name | 2019 |
| Regional level | 6 | Categorical type | 2019 |
| Region type | Municipality | Categorical type | 2019 |
| Region type detail | municipality | Categorical type | 2019 |
| Region name with type | municipality Neukirchen b. Sulzbach-Rosenberg | Name | 2019 |
| Region name in German | Gemeinde Neukirchen b. Sulzbach-Rosenberg | Name | 2019 |
| Direct subregions | no data | Number | 2019 |
| NUTS code | DE234 | Code | 2019 |
| Area | 46 | Area in km² | 2019 |
| Religion | Value | Unit | Year |
|---|---|---|---|
| Roman Catholic church | 766 | Number | 2011 |
| Protestant church | 1.579 | Number | 2011 |
| Other or none | 285 | Number | 2011 |
| % Roman Catholic church | 29% | Percentage | 2011 |
| % Protestant church | 60% | Percentage | 2011 |
| % Other or none | 11% | Percentage | 2011 |
| Roman Catholic church German | 747 | Number | 2011 |
| Protestant church German | 1.579 | Number | 2011 |
| Other or none German | 260 | Number | 2011 |
| % Roman Catholic church German | 29% | Percentage | 2011 |
| % Protestant church German | 61% | Percentage | 2011 |
| % Other or none German Foreign | 10% | Percentage | 2011 |
| Roman Catholic church Foreign | 19 | Number | 2011 |
| Protestant church Foreign | 0 | Number | 2011 |
| Other or none Foreign | 25 | Number | 2011 |
| % Roman Catholic church Foreign | 43% | Percentage | 2011 |
| % Protestant church Foreign | 0% | Percentage | 2011 |
| % Other or none Foreign | 57% | Percentage | 2011 |
Data is used from multiple German open data providers. See this description of the sources with the definitions of all regional topics.
Sources & definitionsThis page will be further expanded with more topics in clear graphs. This will be done in several iterations in the coming weeks.
![]()
© Published:
 Contents and more information: