One moment please, your device is loading the charts...
Population numbers in the municipality Niederotterbach for the years 2009 thru 2019.
The number of inhabitants is the number of persons as registered in the population register on January 1st.
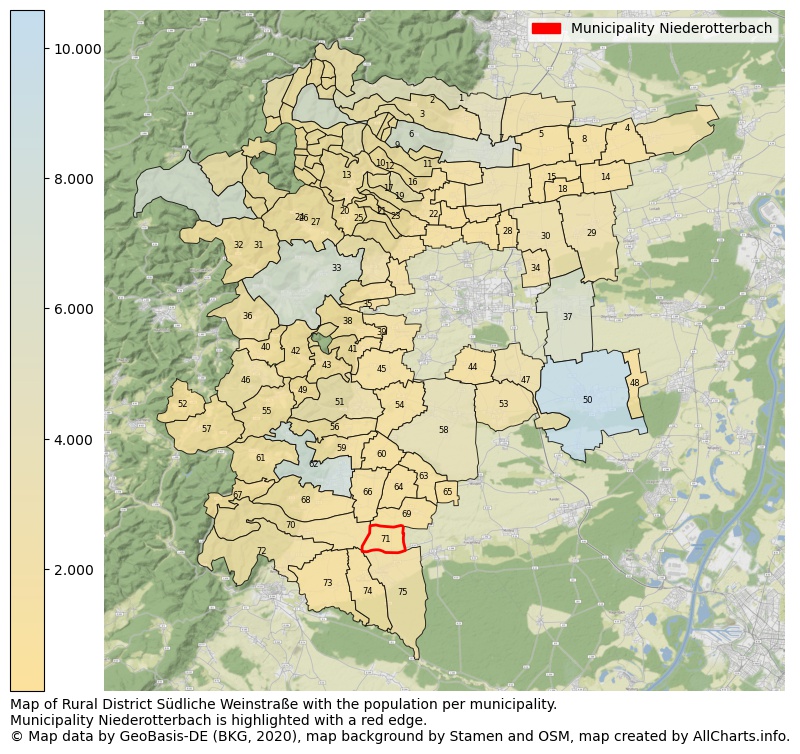
Map of Rural district Südliche Weinstraße with the population per municipality.Municipality Niederotterbach is highlighted with a red edge. The numbers at the map represent the following municipalities: 1: municipality Kirrweiler (Pfalz), 2: municipality Maikammer, 3: municipality Sankt Martin, 4: municipality Gommersheim, 5: municipality Altdorf ...Show more... Map of Rural district Südliche Weinstraße with the population per municipality.Municipality Niederotterbach is highlighted with a red edge. The numbers at the map represent the following municipalities: 1: municipality Kirrweiler (Pfalz), 2: municipality Maikammer, 3: municipality Sankt Martin, 4: municipality Gommersheim, 5: municipality Altdorf, 6: municipality city Edenkoben, 7: municipality Venningen, 8: municipality Böbingen, 9: municipality Rhodt unter Rietburg, 10: municipality Hainfeld, 11: municipality Edesheim, 12: municipality Weyher in der Pfalz, 13: municipality Ramberg, 14: municipality Freimersheim (Pfalz), 15: municipality Großfischlingen, 16: municipality Roschbach, 17: municipality Burrweiler, 18: municipality Kleinfischlingen, 19: municipality Flemlingen, 20: municipality Dernbach, 21: municipality Gleisweiler, 22: municipality Walsheim, 23: municipality Böchingen, 24: municipality Albersweiler, 25: municipality Frankweiler, 26: municipality Eußerthal, 27: municipality Siebeldingen, 28: municipality Knöringen, 29: municipality Hochstadt (Pfalz), 30: municipality Essingen, 31: municipality city Annweiler am Trifels, 32: municipality Rinnthal, 33: municipality Birkweiler, 34: municipality Bornheim, 35: municipality Ranschbach, 36: municipality Wernersberg, 37: municipality Offenbach an der Queich, 38: municipality Leinsweiler, 39: municipality Ilbesheim bei Landau in der Pfalz, 40: municipality Völkersweiler, 41: municipality Eschbach, 42: municipality Waldrohrbach, 43: municipality Waldhambach, 44: municipality Impflingen, 45: municipality Göcklingen, 46: municipality Gossersweiler-Stein, 47: municipality Insheim, 48: municipality Herxheimweyher, 49: municipality Münchweiler am Klingbach, 50: municipality Herxheim bei Landau/Pfalz, 51: municipality Klingenmünster, 52: municipality Oberschlettenbach, 53: municipality Rohrbach, 54: municipality Heuchelheim-Klingen, 55: municipality Silz, 56: municipality Gleiszellen-Gleishorbach, 57: municipality Vorderweidenthal, 58: municipality Billigheim-Ingenheim, 59: municipality Pleisweiler-Oberhofen, 60: municipality Niederhorbach, 61: municipality Birkenhördt, 62: municipality city Bad Bergzabern, 63: municipality Barbelroth, 64: municipality Oberhausen, 65: municipality Hergersweiler, 66: municipality Kapellen-Drusweiler, 67: municipality Böllenborn, 68: municipality Dörrenbach, 69: municipality Dierbach, 70: municipality Oberotterbach, 71: municipality Niederotterbach, 72: municipality Schweigen-Rechtenbach, 73: municipality Schweighofen, 74: municipality Kapsweyer, 75: municipality Steinfeld ...Show less...
One moment please, your device is loading the charts...
Municipality Niederotterbach, 2019, number of rooms per house.
The percentage shows the relative share of houses per category based on the numer of rooms: 1 to 2 rooms, 3 to 4 rooms or 5 rooms or more. This is based on the total number of rooms as identified for all dwellings in the municipality Niederotterbach.
The table below shows data for more than 100 topics as most recently available for the municipality Niederotterbach. Select a category to display the related topics:
| Business | Value | Unit | Year |
|---|---|---|---|
| Businesses | no data | Number | 2015 |
| Active persons | no data | Number | 2015 |
| Gross wages | no data | Euro | 2015 |
| Dwellings | Value | Unit | Year |
|---|---|---|---|
| Houses 1 room | 0 | Number | 2019 |
| Houses 2 rooms | 3 | Number | 2019 |
| Houses 3 rooms | 7 | Number | 2019 |
| Houses 4 rooms | 25 | Number | 2019 |
| Houses 5 rooms | 26 | Number | 2019 |
| Houses 6 rooms | 34 | Number | 2019 |
| Houses 7+ rooms | 51 | Number | 2019 |
| Houses 1-2 rooms | 3 | Number | 2019 |
| Houses 3-4 rooms | 32 | Number | 2019 |
| Houses 5+ rooms | 111 | Number | 2019 |
| 1-2 rooms | 2% | Percentage | 2019 |
| 3-4 rooms | 22% | Percentage | 2019 |
| 5+ rooms | 76% | Percentage | 2019 |
| Elections | Value | Unit | Year |
|---|---|---|---|
| Voters Bundestag | 247,00 | Number | 2017 |
| Voter turnout Bundestag | 87 | Number | 2017 |
| Votes valid Bundestag | 149 | Number | 2017 |
| Votes Bundestag CDU/CSU | 46 | Number | 2017 |
| Votes Bundestag SPD | 41 | Number | 2017 |
| Votes Bundestag GRÜNE | 9 | Number | 2017 |
| Votes Bundestag FDP | 12 | Number | 2017 |
| Votes Bundestag DIE LINKE | 6 | Number | 2017 |
| Votes Bundestag AfD | 27 | Number | 2017 |
| Votes Bundestag other parties | 8 | Number | 2017 |
| Votes Bundestag total | 149 | Number | 2017 |
| % Votes Bundestag CDU/CSU | 19% | Percentage | 2017 |
| % Votes Bundestag SPD | 17% | Percentage | 2017 |
| % Votes Bundestag GRÜNE | 4% | Percentage | 2017 |
| % Votes Bundestag FDP | 5% | Percentage | 2017 |
| % Votes Bundestag DIE LINKE | 2% | Percentage | 2017 |
| % Votes Bundestag AfD | 11% | Percentage | 2017 |
| % Votes Bundestag other parties | 3% | Percentage | 2017 |
| Employment | Value | Unit | Year |
|---|---|---|---|
| Employees | 153 | Number | 2019 |
| Employees male | 78 | Number | 2019 |
| Employees female | 75 | Number | 2019 |
| Employees foreigner | 0 | Number | 2019 |
| Employees male foreigner | 0 | Number | 2019 |
| Employees female foreigner | 0 | Number | 2019 |
| Unemployed | 6 | Number | 2018 |
| Unemployed foreigners | 0 | Number | 2018 |
| Unemployed severely disabled | 0 | Number | 2018 |
| Unemployed 15-20 | 0 | Number | 2018 |
| Unemployed 15-25 | 0 | Number | 2018 |
| Unemployed 55-65 | 2 | Number | 2018 |
| Unemployed long-term | 2 | Number | 2018 |
| % Unemployed | 2% | Percentage | 2018 |
| % Unemployed foreigners | 0% | Percentage of the population | 2018 |
| % Unemployed severely disabled | 0% | Percentage of the population | 2018 |
| % Unemployed 15-20 | 0% | Percentage of the population | 2018 |
| % Unemployed 15-25 | 0% | Percentage of the population | 2018 |
| % Unemployed 55-65 | 1% | Percentage of the population | 2018 |
| % Unemployed long-term | 1% | Percentage of the population | 2018 |
| Income | Value | Unit | Year |
|---|---|---|---|
| Income receivers | 162 | Number | 2015 |
| Income total | €6.953 | Euro | 2015 |
| Income tax | €1.184 | Euro | 2015 |
| Population | Value | Unit | Year |
|---|---|---|---|
| Population | 336 | Number | 2019 |
| Men | 168 | Number | 2019 |
| Women | 168 | Number | 2019 |
| % Men | 50% | Percentage | 2019 |
| % Women | 50% | Percentage | 2019 |
| 0-18 | 57 | Number | 2019 |
| 18-30 | 44 | Number | 2019 |
| 30-45 | 63 | Number | 2019 |
| 45-60 | 88 | Number | 2019 |
| 18-60 | 195 | Number | 2019 |
| 60-75 | 55 | Number | 2019 |
| 60+ | 84 | Number | 2019 |
| Average age | 44 | Average number | 2019 |
| Average age male | 45 | Average number | 2019 |
| Average age female | 43 | Average number | 2019 |
| Births | no data | Number | 2017 |
| Births male | no data | Number | 2017 |
| Births female | no data | Number | 2017 |
| 1K Births | no data | Number per 1000 inhabitants | 2017 |
| Deaths | 4 | Number | 2018 |
| Deaths male | 1 | Number | 2018 |
| Deaths female | 3 | Number | 2018 |
| 1K Deaths | 13 | Number | 2018 |
| 0-3 | 3 | Number | 2019 |
| Girls 0-3 | 2 | Number | 2019 |
| Boys 0-3 | 1 | Number | 2019 |
| 3-6 | 8 | Number | 2019 |
| Girls 3-6 | 6 | Number | 2019 |
| Boys 3-6 | 2 | Number | 2019 |
| 6-10 | 14 | Number | 2019 |
| 10-15 | 18 | Number | 2019 |
| 15-18 | 14 | Number | 2019 |
| 18-20 | 8 | Number | 2019 |
| 20-25 | 17 | Number | 2019 |
| 25-30 | 19 | Number | 2019 |
| 30-35 | 20 | Number | 2019 |
| 35-40 | 22 | Number | 2019 |
| 40-45 | 21 | Number | 2019 |
| 45-50 | 22 | Number | 2019 |
| 50-55 | 36 | Number | 2019 |
| 55-60 | 30 | Number | 2019 |
| 60-65 | 21 | Number | 2019 |
| 65-75 | 34 | Number | 2019 |
| Women 65-70 | 17 | Number | 2019 |
| Men 65-70 | 17 | Number | 2019 |
| 75+ | 29 | Number | 2019 |
| Women 75+ | 14 | Number | 2019 |
| Men 75+ | 15 | Number | 2019 |
| % 0-10 | 7% | Percentage | 2019 |
| % 10-18 | 10% | Percentage | 2019 |
| % 18-30 | 13% | Percentage | 2019 |
| % 30-45 | 19% | Percentage | 2019 |
| % 45-60 | 26% | Percentage | 2019 |
| % 60+ | 25% | Percentage | 2019 |
| Real estate | Value | Unit | Year |
|---|---|---|---|
| Property tax A revenue | no data | Euro | no data |
| Property tax B revenue | no data | Euro | no data |
| Trade tax actual revenue | no data | Euro | no data |
| Property tax A basic amount | no data | Euro | no data |
| Property tax B basic amount | no data | Euro | no data |
| Trade tax basic amount | no data | Euro | no data |
| Property tax A rate | €300 | Euro | 2018 |
| Property tax B rate | no data | Euro | no data |
| Trade tax rate | no data | Euro | no data |
| Real tax raising force | no data | Euro | no data |
| Trade tax levy | €7.772 | Euro | 2018 |
| Trade tax net | €33.764 | Euro | 2018 |
| Community share in income tax | no data | Euro | no data |
| Community share in sales tax | no data | Euro | no data |
| Tax revenue | no data | Euro | no data |
| Regional | Value | Unit | Year |
|---|---|---|---|
| Region code | 073375002056 | Code | 2019 |
| Region code 8 digits | 07337056 | Code | 07337056 |
| Sorting code | 073375002056 | Code | 073375002056 |
| Sorting code 8 digits | 07337056 | Code | 07337056 |
| Region name | Niederotterbach | Name | 2019 |
| Regional level | 6 | Categorical type | 2019 |
| Region type | Municipality | Categorical type | 2019 |
| Region type detail | municipality | Categorical type | 2019 |
| Region name with type | municipality Niederotterbach | Name | 2019 |
| Region name in German | Gemeinde Niederotterbach | Name | 2019 |
| Direct subregions | no data | Number | 2019 |
| NUTS code | DEB3H | Code | 2019 |
| Area | 4 | Area in km² | 2019 |
| Religion | Value | Unit | Year |
|---|---|---|---|
| Roman Catholic church | 161 | Number | 2011 |
| Protestant church | 87 | Number | 2011 |
| Other or none | 85 | Number | 2011 |
| % Roman Catholic church | 48% | Percentage | 2011 |
| % Protestant church | 26% | Percentage | 2011 |
| % Other or none | 26% | Percentage | 2011 |
| Roman Catholic church German | 158 | Number | 2011 |
| Protestant church German | 87 | Number | 2011 |
| Other or none German | 82 | Number | 2011 |
| % Roman Catholic church German | 48% | Percentage | 2011 |
| % Protestant church German | 27% | Percentage | 2011 |
| % Other or none German Foreign | 25% | Percentage | 2011 |
| Roman Catholic church Foreign | 3 | Number | 2011 |
| Protestant church Foreign | 0 | Number | 2011 |
| Other or none Foreign | 3 | Number | 2011 |
| % Roman Catholic church Foreign | 50% | Percentage | 2011 |
| % Protestant church Foreign | 0% | Percentage | 2011 |
| % Other or none Foreign | 50% | Percentage | 2011 |
Data is used from multiple German open data providers. See this description of the sources with the definitions of all regional topics.
Sources & definitionsThis page will be further expanded with more topics in clear graphs. This will be done in several iterations in the coming weeks.
![]()
© Published:
 Contents and more information: