One moment please, your device is loading the charts...
Population numbers in the municipality Rietz-Neuendorf for the years 2009 thru 2019.
The number of inhabitants is the number of persons as registered in the population register on January 1st.
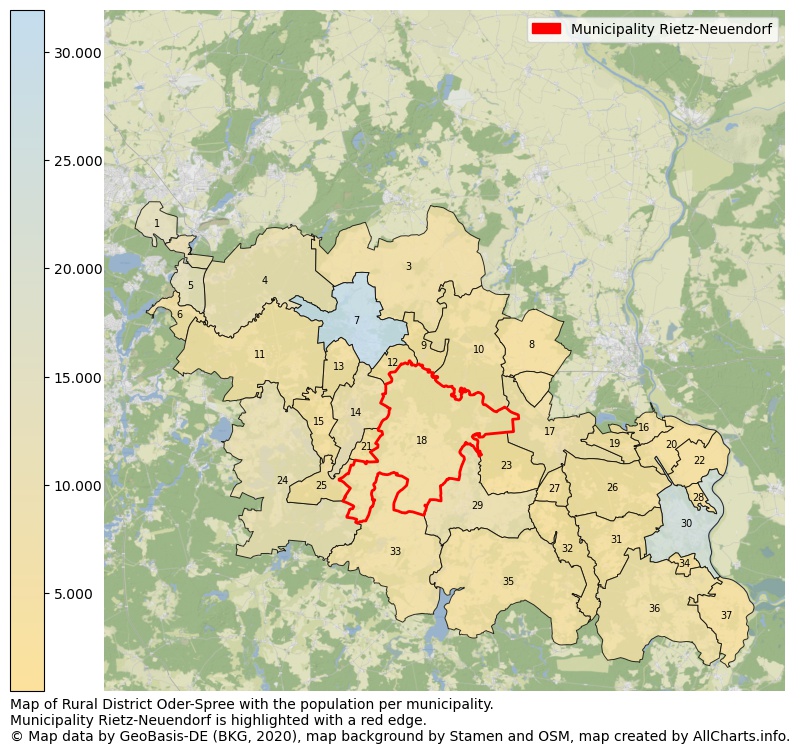
Map of Rural district Oder-Spree with the population per municipality.Municipality Rietz-Neuendorf is highlighted with a red edge. The numbers at the map represent the following municipalities: 1: municipality Schöneiche bei Berlin, 2: municipality Woltersdorf, 3: municipality Steinhöfel, 4: municipality Grünheide (Mark), 5: municipality city Erkner ...Show more... Map of Rural district Oder-Spree with the population per municipality.Municipality Rietz-Neuendorf is highlighted with a red edge. The numbers at the map represent the following municipalities: 1: municipality Schöneiche bei Berlin, 2: municipality Woltersdorf, 3: municipality Steinhöfel, 4: municipality Grünheide (Mark), 5: municipality city Erkner, 6: municipality Gosen-Neu Zittau, 7: municipality city Fürstenwalde/Spree, 8: municipality Jacobsdorf, 9: municipality Berkenbrück, 10: municipality Briesen (Mark), 11: municipality Spreenhagen, 12: municipality Langewahl, 13: municipality Rauen, 14: municipality Bad Saarow, 15: municipality Reichenwalde, 16: municipality Brieskow-Finkenheerd, 17: municipality city Müllrose, 18: municipality Rietz-Neuendorf, 19: municipality Groß Lindow, 20: municipality Wiesenau, 21: municipality Diensdorf-Radlow, 22: municipality Ziltendorf, 23: municipality Ragow-Merz, 24: municipality city Storkow (Mark), 25: municipality Wendisch Rietz, 26: municipality Siehdichum, 27: municipality Mixdorf, 28: municipality Vogelsang, 29: municipality city Beeskow, 30: municipality city Eisenhüttenstadt, 31: municipality Schlaubetal, 32: municipality Grunow-Dammendorf, 33: municipality Tauche, 34: municipality Lawitz, 35: municipality city Friedland, 36: municipality Neuzelle, 37: municipality Neißemünde ...Show less...
One moment please, your device is loading the charts...
Municipality Rietz-Neuendorf, 2019, number of rooms per house.
The percentage shows the relative share of houses per category based on the numer of rooms: 1 to 2 rooms, 3 to 4 rooms or 5 rooms or more. This is based on the total number of rooms as identified for all dwellings in the municipality Rietz-Neuendorf.
The table below shows data for more than 100 topics as most recently available for the municipality Rietz-Neuendorf. Select a category to display the related topics:
| Business | Value | Unit | Year |
|---|---|---|---|
| Businesses | 1 | Number | 2017 |
| Active persons | 0 | Number | 2017 |
| Gross wages | €0 | Euro | 2017 |
| Dwellings | Value | Unit | Year |
|---|---|---|---|
| Houses 1 room | 14 | Number | 2019 |
| Houses 2 rooms | 66 | Number | 2019 |
| Houses 3 rooms | 275 | Number | 2019 |
| Houses 4 rooms | 497 | Number | 2019 |
| Houses 5 rooms | 490 | Number | 2019 |
| Houses 6 rooms | 339 | Number | 2019 |
| Houses 7+ rooms | 311 | Number | 2019 |
| Houses 1-2 rooms | 80 | Number | 2019 |
| Houses 3-4 rooms | 772 | Number | 2019 |
| Houses 5+ rooms | 1.140 | Number | 2019 |
| 1-2 rooms | 4% | Percentage | 2019 |
| 3-4 rooms | 39% | Percentage | 2019 |
| 5+ rooms | 57% | Percentage | 2019 |
| Elections | Value | Unit | Year |
|---|---|---|---|
| Voters Bundestag | 3478,00 | Number | 2017 |
| Voter turnout Bundestag | 77 | Number | 2017 |
| Votes valid Bundestag | 2.636 | Number | 2017 |
| Votes Bundestag CDU/CSU | 641 | Number | 2017 |
| Votes Bundestag SPD | 452 | Number | 2017 |
| Votes Bundestag GRÜNE | 110 | Number | 2017 |
| Votes Bundestag FDP | 154 | Number | 2017 |
| Votes Bundestag DIE LINKE | 444 | Number | 2017 |
| Votes Bundestag AfD | 631 | Number | 2017 |
| Votes Bundestag other parties | 204 | Number | 2017 |
| Votes Bundestag total | 2.636 | Number | 2017 |
| % Votes Bundestag CDU/CSU | 18% | Percentage | 2017 |
| % Votes Bundestag SPD | 13% | Percentage | 2017 |
| % Votes Bundestag GRÜNE | 3% | Percentage | 2017 |
| % Votes Bundestag FDP | 4% | Percentage | 2017 |
| % Votes Bundestag DIE LINKE | 13% | Percentage | 2017 |
| % Votes Bundestag AfD | 18% | Percentage | 2017 |
| % Votes Bundestag other parties | 6% | Percentage | 2017 |
| Employment | Value | Unit | Year |
|---|---|---|---|
| Employees | 1.697 | Number | 2019 |
| Employees male | 884 | Number | 2019 |
| Employees female | 813 | Number | 2019 |
| Employees foreigner | 9 | Number | 2019 |
| Employees male foreigner | 0 | Number | 2019 |
| Employees female foreigner | 0 | Number | 2019 |
| Unemployed | 103 | Number | 2018 |
| Unemployed foreigners | 1 | Number | 2018 |
| Unemployed severely disabled | 3 | Number | 2018 |
| Unemployed 15-20 | 1 | Number | 2018 |
| Unemployed 15-25 | 5 | Number | 2018 |
| Unemployed 55-65 | 40 | Number | 2018 |
| Unemployed long-term | 35 | Number | 2018 |
| % Unemployed | 3% | Percentage | 2018 |
| % Unemployed foreigners | 0% | Percentage of the population | 2018 |
| % Unemployed severely disabled | 0% | Percentage of the population | 2018 |
| % Unemployed 15-20 | 0% | Percentage of the population | 2018 |
| % Unemployed 15-25 | 0% | Percentage of the population | 2018 |
| % Unemployed 55-65 | 1% | Percentage of the population | 2018 |
| % Unemployed long-term | 1% | Percentage of the population | 2018 |
| Income | Value | Unit | Year |
|---|---|---|---|
| Income receivers | 1.938 | Number | 2015 |
| Income total | €60.507 | Euro | 2015 |
| Income tax | €8.473 | Euro | 2015 |
| Population | Value | Unit | Year |
|---|---|---|---|
| Population | 4.102 | Number | 2019 |
| Men | 2.063 | Number | 2019 |
| Women | 2.039 | Number | 2019 |
| % Men | 50% | Percentage | 2019 |
| % Women | 50% | Percentage | 2019 |
| 0-18 | 642 | Number | 2019 |
| 18-30 | 267 | Number | 2019 |
| 30-45 | 710 | Number | 2019 |
| 45-60 | 1.128 | Number | 2019 |
| 18-60 | 2.105 | Number | 2019 |
| 60-75 | 871 | Number | 2019 |
| 60+ | 1.355 | Number | 2019 |
| Average age | 48 | Average number | 2019 |
| Average age male | 48 | Average number | 2019 |
| Average age female | 48 | Average number | 2019 |
| Births | 26 | Number | 2018 |
| Births male | 15 | Number | 2018 |
| Births female | 11 | Number | 2018 |
| 1K Births | 6 | Number per 1000 inhabitants | 2018 |
| Deaths | 50 | Number | 2018 |
| Deaths male | 33 | Number | 2018 |
| Deaths female | 17 | Number | 2018 |
| 1K Deaths | 12 | Number | 2018 |
| 0-3 | 87 | Number | 2019 |
| Girls 0-3 | 36 | Number | 2019 |
| Boys 0-3 | 51 | Number | 2019 |
| 3-6 | 105 | Number | 2019 |
| Girls 3-6 | 58 | Number | 2019 |
| Boys 3-6 | 47 | Number | 2019 |
| 6-10 | 158 | Number | 2019 |
| 10-15 | 188 | Number | 2019 |
| 15-18 | 104 | Number | 2019 |
| 18-20 | 49 | Number | 2019 |
| 20-25 | 83 | Number | 2019 |
| 25-30 | 135 | Number | 2019 |
| 30-35 | 226 | Number | 2019 |
| 35-40 | 267 | Number | 2019 |
| 40-45 | 217 | Number | 2019 |
| 45-50 | 251 | Number | 2019 |
| 50-55 | 442 | Number | 2019 |
| 55-60 | 435 | Number | 2019 |
| 60-65 | 391 | Number | 2019 |
| 65-75 | 480 | Number | 2019 |
| Women 65-70 | 237 | Number | 2019 |
| Men 65-70 | 243 | Number | 2019 |
| 75+ | 484 | Number | 2019 |
| Women 75+ | 275 | Number | 2019 |
| Men 75+ | 209 | Number | 2019 |
| % 0-10 | 9% | Percentage | 2019 |
| % 10-18 | 7% | Percentage | 2019 |
| % 18-30 | 7% | Percentage | 2019 |
| % 30-45 | 17% | Percentage | 2019 |
| % 45-60 | 27% | Percentage | 2019 |
| % 60+ | 33% | Percentage | 2019 |
| Real estate | Value | Unit | Year |
|---|---|---|---|
| Property tax A revenue | no data | Euro | no data |
| Property tax B revenue | no data | Euro | no data |
| Trade tax actual revenue | no data | Euro | no data |
| Property tax A basic amount | no data | Euro | no data |
| Property tax B basic amount | no data | Euro | no data |
| Trade tax basic amount | no data | Euro | no data |
| Property tax A rate | no data | Euro | no data |
| Property tax B rate | no data | Euro | no data |
| Trade tax rate | no data | Euro | no data |
| Real tax raising force | no data | Euro | no data |
| Trade tax levy | no data | Euro | no data |
| Trade tax net | no data | Euro | no data |
| Community share in income tax | no data | Euro | no data |
| Community share in sales tax | no data | Euro | no data |
| Tax revenue | no data | Euro | no data |
| Regional | Value | Unit | Year |
|---|---|---|---|
| Region code | 120670426426 | Code | 2019 |
| Region code 8 digits | 12067426 | Code | 12067426 |
| Sorting code | 120670426426 | Code | 120670426426 |
| Sorting code 8 digits | 12067426 | Code | 12067426 |
| Region name | Rietz-Neuendorf | Name | 2019 |
| Regional level | 6 | Categorical type | 2019 |
| Region type | Municipality | Categorical type | 2019 |
| Region type detail | municipality | Categorical type | 2019 |
| Region name with type | municipality Rietz-Neuendorf | Name | 2019 |
| Region name in German | Gemeinde Rietz-Neuendorf | Name | 2019 |
| Direct subregions | no data | Number | 2019 |
| NUTS code | DE40C | Code | 2019 |
| Area | 185 | Area in km² | 2019 |
| Religion | Value | Unit | Year |
|---|---|---|---|
| Roman Catholic church | 41 | Number | 2011 |
| Protestant church | 1.339 | Number | 2011 |
| Other or none | 2.852 | Number | 2011 |
| % Roman Catholic church | 1% | Percentage | 2011 |
| % Protestant church | 32% | Percentage | 2011 |
| % Other or none | 67% | Percentage | 2011 |
| Roman Catholic church German | 41 | Number | 2011 |
| Protestant church German | 1.339 | Number | 2011 |
| Other or none German | 2.842 | Number | 2011 |
| % Roman Catholic church German | 1% | Percentage | 2011 |
| % Protestant church German | 32% | Percentage | 2011 |
| % Other or none German Foreign | 67% | Percentage | 2011 |
| Roman Catholic church Foreign | 0 | Number | 2011 |
| Protestant church Foreign | 0 | Number | 2011 |
| Other or none Foreign | 10 | Number | 2011 |
| % Roman Catholic church Foreign | 0% | Percentage | 2011 |
| % Protestant church Foreign | 0% | Percentage | 2011 |
| % Other or none Foreign | 100% | Percentage | 2011 |
Data is used from multiple German open data providers. See this description of the sources with the definitions of all regional topics.
Sources & definitionsThis page will be further expanded with more topics in clear graphs. This will be done in several iterations in the coming weeks.
![]()
© Published:
 Contents and more information: