Population numbers per year
The number of inhabitants in the municipality Schönenberg-Kübelberg
One moment please, your device is loading the charts...
Population numbers in the municipality Schönenberg-Kübelberg for the years 2009 thru 2019.
The number of inhabitants is the number of persons as registered in the population register on January 1st.
Population at the map of Schönenberg-Kübelberg
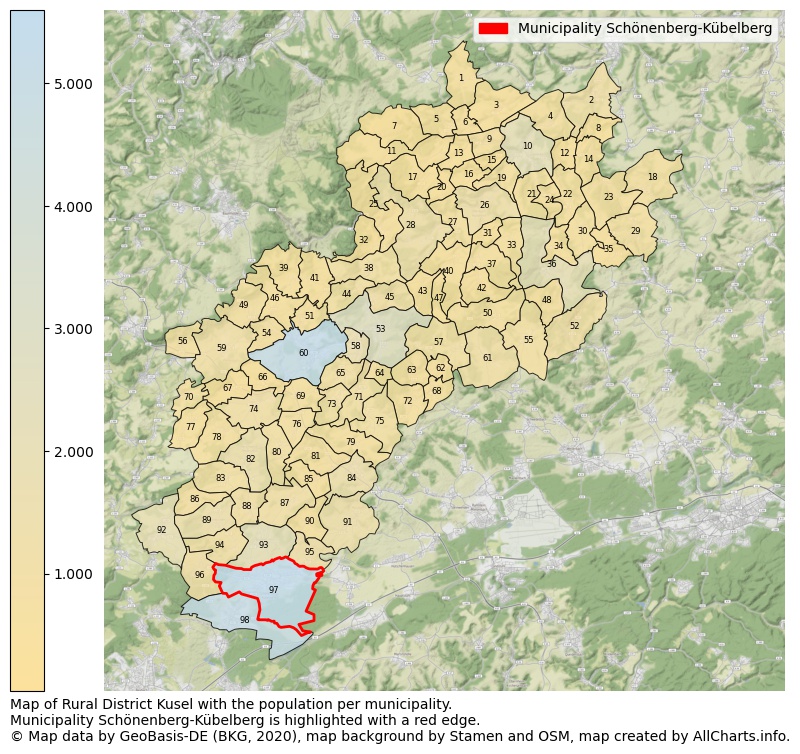
Map of Rural district Kusel with the population per municipality.Municipality Schönenberg-Kübelberg is highlighted with a red edge. The numbers at the map represent the following municipalities: 1: municipality Hoppstädten, 2: municipality Odenbach, 3: municipality Kappeln, 4: municipality Medard, 5: municipality Langweiler ...Show more... Map of Rural district Kusel with the population per municipality.Municipality Schönenberg-Kübelberg is highlighted with a red edge. The numbers at the map represent the following municipalities: 1: municipality Hoppstädten, 2: municipality Odenbach, 3: municipality Kappeln, 4: municipality Medard, 5: municipality Langweiler, 6: municipality Merzweiler, 7: municipality Unterjeckenbach, 8: municipality Adenbach, 9: municipality Grumbach, 10: municipality city Lauterecken, 11: municipality Homberg, 12: municipality Cronenberg, 13: municipality Herren-Sulzbach, 14: municipality Ginsweiler, 15: municipality Hausweiler, 16: municipality Buborn, 17: municipality Kirrweiler, 18: municipality Nußbach, 19: municipality Wiesweiler, 20: municipality Deimberg, 21: municipality Lohnweiler, 22: municipality Hohenöllen, 23: municipality Reipoltskirchen, 24: municipality Heinzenhausen, 25: municipality Niederalben, 26: municipality Offenbach-Hundheim, 27: municipality Glanbrücken, 28: municipality Sankt Julian, 29: municipality Hefersweiler, 30: municipality Einöllen, 31: municipality Nerzweiler, 32: municipality Rathsweiler, 33: municipality Aschbach, 34: municipality Oberweiler-Tiefenbach, 35: municipality Relsberg, 36: municipality city Wolfstein, 37: municipality Hinzweiler, 38: municipality Ulmet, 39: municipality Dennweiler-Frohnbach, 40: municipality Horschbach, 41: municipality Oberalben, 42: municipality Oberweiler im Tal, 43: municipality Welchweiler, 44: municipality Erdesbach, 45: municipality Bedesbach, 46: municipality Körborn, 47: municipality Elzweiler, 48: municipality Rutsweiler an der Lauter, 49: municipality Thallichtenberg, 50: municipality Eßweiler, 51: municipality Blaubach, 52: municipality Kreimbach-Kaulbach, 53: municipality Altenglan, 54: municipality Ruthweiler, 55: municipality Rothselberg, 56: municipality Reichweiler, 57: municipality Bosenbach, 58: municipality Rammelsbach, 59: municipality Pfeffelbach, 60: municipality city Kusel, 61: municipality Jettenbach, 62: municipality Niederstaufenbach, 63: municipality Föckelberg, 64: municipality Rutsweiler am Glan, 65: municipality Haschbach am Remigiusberg, 66: municipality Ehweiler, 67: municipality Albessen, 68: municipality Oberstaufenbach, 69: municipality Schellweiler, 70: municipality Herchweiler, 71: municipality Theisbergstegen, 72: municipality Neunkirchen am Potzberg, 73: municipality Etschberg, 74: municipality Konken, 75: municipality Matzenbach, 76: municipality Hüffler, 77: municipality Selchenbach, 78: municipality Langenbach, 79: municipality Rehweiler, 80: municipality Wahnwegen, 81: municipality Quirnbach/Pfalz, 82: municipality Herschweiler-Pettersheim, 83: municipality Krottelbach, 84: municipality Glan-Münchweiler, 85: municipality Henschtal, 86: municipality Frohnhofen, 87: municipality Steinbach am Glan, 88: municipality Ohmbach, 89: municipality Altenkirchen, 90: municipality Börsborn, 91: municipality Nanzdietschweiler, 92: municipality Breitenbach, 93: municipality Brücken (Pfalz), 94: municipality Dittweiler, 95: municipality Gries, 96: municipality Dunzweiler, 97: municipality Schönenberg-Kübelberg, 98: municipality Waldmohr ...Show less...
The number of rooms per house (dwelling)
The number of rooms of the houses in the municipality Schönenberg-Kübelberg
One moment please, your device is loading the charts...
Municipality Schönenberg-Kübelberg, 2019, number of rooms per house.
The percentage shows the relative share of houses per category based on the numer of rooms: 1 to 2 rooms, 3 to 4 rooms or 5 rooms or more. This is based on the total number of rooms as identified for all dwellings in the municipality Schönenberg-Kübelberg.
Data about more than 100 topics!
The table below shows data for more than 100 topics as most recently available for the municipality Schönenberg-Kübelberg. Select a category to display the related topics:
| Business | Value | Unit | Year |
|---|---|---|---|
| Businesses | 2 | Number | 2017 |
| Active persons | 0 | Number | 2017 |
| Gross wages | €0 | Euro | 2017 |
| Dwellings | Value | Unit | Year |
|---|---|---|---|
| Houses 1 room | 22 | Number | 2019 |
| Houses 2 rooms | 111 | Number | 2019 |
| Houses 3 rooms | 377 | Number | 2019 |
| Houses 4 rooms | 496 | Number | 2019 |
| Houses 5 rooms | 536 | Number | 2019 |
| Houses 6 rooms | 541 | Number | 2019 |
| Houses 7+ rooms | 743 | Number | 2019 |
| Houses 1-2 rooms | 133 | Number | 2019 |
| Houses 3-4 rooms | 873 | Number | 2019 |
| Houses 5+ rooms | 1.820 | Number | 2019 |
| 1-2 rooms | 5% | Percentage | 2019 |
| 3-4 rooms | 31% | Percentage | 2019 |
| 5+ rooms | 64% | Percentage | 2019 |
| Elections | Value | Unit | Year |
|---|---|---|---|
| Voters Bundestag | 4400,00 | Number | 2017 |
| Voter turnout Bundestag | 69 | Number | 2017 |
| Votes valid Bundestag | 2.322 | Number | 2017 |
| Votes Bundestag CDU/CSU | 776 | Number | 2017 |
| Votes Bundestag SPD | 608 | Number | 2017 |
| Votes Bundestag GRÜNE | 104 | Number | 2017 |
| Votes Bundestag FDP | 145 | Number | 2017 |
| Votes Bundestag DIE LINKE | 199 | Number | 2017 |
| Votes Bundestag AfD | 379 | Number | 2017 |
| Votes Bundestag other parties | 111 | Number | 2017 |
| Votes Bundestag total | 2.322 | Number | 2017 |
| % Votes Bundestag CDU/CSU | 18% | Percentage | 2017 |
| % Votes Bundestag SPD | 14% | Percentage | 2017 |
| % Votes Bundestag GRÜNE | 2% | Percentage | 2017 |
| % Votes Bundestag FDP | 3% | Percentage | 2017 |
| % Votes Bundestag DIE LINKE | 5% | Percentage | 2017 |
| % Votes Bundestag AfD | 9% | Percentage | 2017 |
| % Votes Bundestag other parties | 3% | Percentage | 2017 |
| Employment | Value | Unit | Year |
|---|---|---|---|
| Employees | 2.208 | Number | 2019 |
| Employees male | 1.223 | Number | 2019 |
| Employees female | 985 | Number | 2019 |
| Employees foreigner | 124 | Number | 2019 |
| Employees male foreigner | 90 | Number | 2019 |
| Employees female foreigner | 34 | Number | 2019 |
| Unemployed | 110 | Number | 2018 |
| Unemployed foreigners | 8 | Number | 2018 |
| Unemployed severely disabled | 10 | Number | 2018 |
| Unemployed 15-20 | 1 | Number | 2018 |
| Unemployed 15-25 | 7 | Number | 2018 |
| Unemployed 55-65 | 44 | Number | 2018 |
| Unemployed long-term | 27 | Number | 2018 |
| % Unemployed | 2% | Percentage | 2018 |
| % Unemployed foreigners | 0% | Percentage of the population | 2018 |
| % Unemployed severely disabled | 0% | Percentage of the population | 2018 |
| % Unemployed 15-20 | 0% | Percentage of the population | 2018 |
| % Unemployed 15-25 | 0% | Percentage of the population | 2018 |
| % Unemployed 55-65 | 1% | Percentage of the population | 2018 |
| % Unemployed long-term | 0% | Percentage of the population | 2018 |
| Income | Value | Unit | Year |
|---|---|---|---|
| Income receivers | 2.603 | Number | 2015 |
| Income total | €91.887 | Euro | 2015 |
| Income tax | €14.376 | Euro | 2015 |
| Population | Value | Unit | Year |
|---|---|---|---|
| Population | 5.600 | Number | 2019 |
| Men | 2.765 | Number | 2019 |
| Women | 2.835 | Number | 2019 |
| % Men | 49% | Percentage | 2019 |
| % Women | 51% | Percentage | 2019 |
| 0-18 | 996 | Number | 2019 |
| 18-30 | 749 | Number | 2019 |
| 30-45 | 939 | Number | 2019 |
| 45-60 | 1.285 | Number | 2019 |
| 18-60 | 2.973 | Number | 2019 |
| 60-75 | 1.007 | Number | 2019 |
| 60+ | 1.631 | Number | 2019 |
| Average age | 44 | Average number | 2019 |
| Average age male | 43 | Average number | 2019 |
| Average age female | 46 | Average number | 2019 |
| Births | 70 | Number | 2018 |
| Births male | 37 | Number | 2018 |
| Births female | 33 | Number | 2018 |
| 1K Births | 12 | Number per 1000 inhabitants | 2018 |
| Deaths | 66 | Number | 2018 |
| Deaths male | 28 | Number | 2018 |
| Deaths female | 38 | Number | 2018 |
| 1K Deaths | 12 | Number | 2018 |
| 0-3 | 184 | Number | 2019 |
| Girls 0-3 | 80 | Number | 2019 |
| Boys 0-3 | 104 | Number | 2019 |
| 3-6 | 174 | Number | 2019 |
| Girls 3-6 | 88 | Number | 2019 |
| Boys 3-6 | 86 | Number | 2019 |
| 6-10 | 196 | Number | 2019 |
| 10-15 | 259 | Number | 2019 |
| 15-18 | 183 | Number | 2019 |
| 18-20 | 112 | Number | 2019 |
| 20-25 | 317 | Number | 2019 |
| 25-30 | 320 | Number | 2019 |
| 30-35 | 327 | Number | 2019 |
| 35-40 | 320 | Number | 2019 |
| 40-45 | 292 | Number | 2019 |
| 45-50 | 328 | Number | 2019 |
| 50-55 | 471 | Number | 2019 |
| 55-60 | 486 | Number | 2019 |
| 60-65 | 398 | Number | 2019 |
| 65-75 | 609 | Number | 2019 |
| Women 65-70 | 314 | Number | 2019 |
| Men 65-70 | 295 | Number | 2019 |
| 75+ | 624 | Number | 2019 |
| Women 75+ | 363 | Number | 2019 |
| Men 75+ | 261 | Number | 2019 |
| % 0-10 | 10% | Percentage | 2019 |
| % 10-18 | 8% | Percentage | 2019 |
| % 18-30 | 13% | Percentage | 2019 |
| % 30-45 | 17% | Percentage | 2019 |
| % 45-60 | 23% | Percentage | 2019 |
| % 60+ | 29% | Percentage | 2019 |
| Real estate | Value | Unit | Year |
|---|---|---|---|
| Property tax A revenue | no data | Euro | no data |
| Property tax B revenue | no data | Euro | no data |
| Trade tax actual revenue | no data | Euro | no data |
| Property tax A basic amount | no data | Euro | no data |
| Property tax B basic amount | no data | Euro | no data |
| Trade tax basic amount | no data | Euro | no data |
| Property tax A rate | €300 | Euro | 2018 |
| Property tax B rate | no data | Euro | no data |
| Trade tax rate | no data | Euro | no data |
| Real tax raising force | no data | Euro | no data |
| Trade tax levy | €515.102 | Euro | 2018 |
| Trade tax net | €2.237.637 | Euro | 2018 |
| Community share in income tax | no data | Euro | no data |
| Community share in sales tax | no data | Euro | no data |
| Tax revenue | no data | Euro | no data |
| Regional | Value | Unit | Year |
|---|---|---|---|
| Region code | 073365009092 | Code | 2019 |
| Region code 8 digits | 07336092 | Code | 07336092 |
| Sorting code | 073365009092 | Code | 073365009092 |
| Sorting code 8 digits | 07336092 | Code | 07336092 |
| Region name | Schönenberg-Kübelberg | Name | 2019 |
| Regional level | 6 | Categorical type | 2019 |
| Region type | Municipality | Categorical type | 2019 |
| Region type detail | municipality | Categorical type | 2019 |
| Region name with type | municipality Schönenberg-Kübelberg | Name | 2019 |
| Region name in German | Gemeinde Schönenberg-Kübelberg | Name | 2019 |
| Direct subregions | no data | Number | 2019 |
| NUTS code | DEB3G | Code | 2019 |
| Area | 19 | Area in km² | 2019 |
| Religion | Value | Unit | Year |
|---|---|---|---|
| Roman Catholic church | 2.254 | Number | 2011 |
| Protestant church | 1.969 | Number | 2011 |
| Other or none | 1.396 | Number | 2011 |
| % Roman Catholic church | 40% | Percentage | 2011 |
| % Protestant church | 35% | Percentage | 2011 |
| % Other or none | 25% | Percentage | 2011 |
| Roman Catholic church German | 2.189 | Number | 2011 |
| Protestant church German | 1.947 | Number | 2011 |
| Other or none German | 1.290 | Number | 2011 |
| % Roman Catholic church German | 40% | Percentage | 2011 |
| % Protestant church German | 36% | Percentage | 2011 |
| % Other or none German Foreign | 24% | Percentage | 2011 |
| Roman Catholic church Foreign | 65 | Number | 2011 |
| Protestant church Foreign | 22 | Number | 2011 |
| Other or none Foreign | 106 | Number | 2011 |
| % Roman Catholic church Foreign | 34% | Percentage | 2011 |
| % Protestant church Foreign | 11% | Percentage | 2011 |
| % Other or none Foreign | 55% | Percentage | 2011 |
Open data sources used
Data is used from multiple German open data providers. See this description of the sources with the definitions of all regional topics.
Sources & definitionsUnder development
Work is in progress to add more information to this page
This page will be further expanded with more topics in clear graphs. This will be done in several iterations in the coming weeks.