Population numbers per year
The number of inhabitants in the municipality Thörlingen
One moment please, your device is loading the charts...
Population numbers in the municipality Thörlingen for the years 2009 thru 2019.
The number of inhabitants is the number of persons as registered in the population register on January 1st.
Population at the map of Thörlingen
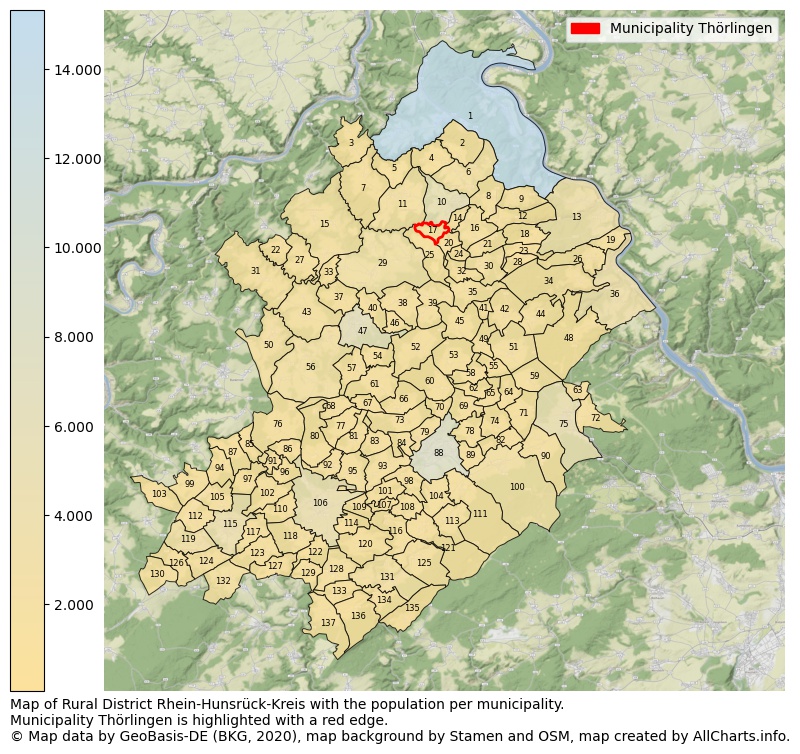
Map of Rural district Rhein-Hunsrück-Kreis with the population per municipality.Municipality Thörlingen is highlighted with a red edge. The numbers at the map represent the following municipalities: 1: municipality city Boppard, 2: municipality Kratzenburg, 3: municipality Morshausen, 4: municipality Ney, 5: municipality Mermuth ...Show more... Map of Rural district Rhein-Hunsrück-Kreis with the population per municipality.Municipality Thörlingen is highlighted with a red edge. The numbers at the map represent the following municipalities: 1: municipality city Boppard, 2: municipality Kratzenburg, 3: municipality Morshausen, 4: municipality Ney, 5: municipality Mermuth, 6: municipality Halsenbach, 7: municipality Beulich, 8: municipality Dörth, 9: municipality Karbach, 10: municipality city Emmelshausen, 11: municipality Gondershausen, 12: municipality Hungenroth, 13: municipality city Sankt Goar, 14: municipality Schwall, 15: municipality Dommershausen, 16: municipality Leiningen, 17: municipality Thörlingen, 18: municipality Utzenhain, 19: municipality Urbar, 20: municipality Niedert, 21: municipality Norath, 22: municipality Lahr, 23: municipality Badenhard, 24: municipality Mühlpfad, 25: municipality Bickenbach, 26: municipality Niederburg, 27: municipality Zilshausen, 28: municipality Birkheim, 29: municipality Beltheim, 30: municipality Pfalzfeld, 31: municipality Mörsdorf, 32: municipality Hausbay, 33: municipality Korweiler, 34: municipality Damscheid, 35: municipality Lingerhahn, 36: municipality city Oberwesel, 37: municipality Uhler, 38: municipality Gödenroth, 39: municipality Braunshorn, 40: municipality Roth, 41: municipality Maisborn, 42: municipality Laudert, 43: municipality Buch, 44: municipality Wiebelsheim, 45: municipality Bubach, 46: municipality Hollnich, 47: municipality city Kastellaun, 48: municipality Perscheid, 49: municipality Riegenroth, 50: municipality Mastershausen, 51: municipality Kisselbach, 52: municipality Laubach, 53: municipality Horn, 54: municipality Spesenroth, 55: municipality Steinbach, 56: municipality Bell (Hunsrück), 57: municipality Hasselbach, 58: municipality Budenbach, 59: municipality Liebshausen, 60: municipality Klosterkumbd, 61: municipality Alterkülz, 62: municipality Bergenhausen, 63: municipality Erbach, 64: municipality Benzweiler, 65: municipality Rayerschied, 66: municipality Neuerkirch, 67: municipality Michelbach, 68: municipality Wüschheim, 69: municipality Pleizenhausen, 70: municipality Niederkumbd, 71: municipality Mörschbach, 72: municipality Dichtelbach, 73: municipality Külz (Hunsrück), 74: municipality Wahlbach, 75: municipality city Rheinböllen, 76: municipality Kappel, 77: municipality Reich, 78: municipality Altweidelbach, 79: municipality Kümbdchen, 80: municipality Reckershausen, 81: municipality Biebern, 82: municipality Schnorbach, 83: municipality Fronhofen, 84: municipality Keidelheim, 85: municipality Rödelhausen, 86: municipality Kludenbach, 87: municipality Belg, 88: municipality city Simmern/Hunsrück, 89: municipality Mutterschied, 90: municipality Ellern (Hunsrück), 91: municipality Todenroth, 92: municipality Heinzenbach, 93: municipality Nannhausen, 94: municipality Würrich, 95: municipality Unzenberg, 96: municipality Metzenhausen, 97: municipality Schwarzen, 98: municipality Ohlweiler, 99: municipality Hahn, 100: municipality Argenthal, 101: municipality Schönborn, 102: municipality Ober Kostenz, 103: municipality Raversbeuren, 104: municipality Holzbach, 105: municipality Bärenbach, 106: municipality city Kirchberg (Hunsrück), 107: municipality Oppertshausen, 108: municipality Belgweiler, 109: municipality Rödern, 110: municipality Nieder Kostenz, 111: municipality Riesweiler, 112: municipality Lautzenhausen, 113: municipality Tiefenbach, 114: municipality Maitzborn, 115: municipality Sohren, 116: municipality Ravengiersburg, 117: municipality Niedersohren, 118: municipality Dillendorf, 119: municipality Büchenbeuren, 120: municipality Womrath, 121: municipality Sargenroth, 122: municipality Hecken, 123: municipality Dill, 124: municipality Niederweiler, 125: municipality Mengerschied, 126: municipality Wahlenau, 127: municipality Sohrschied, 128: municipality Dickenschied, 129: municipality Lindenschied, 130: municipality Hirschfeld (Hunsrück), 131: municipality Gemünden, 132: municipality Laufersweiler, 133: municipality Rohrbach, 134: municipality Gehlweiler, 135: municipality Henau, 136: municipality Schlierschied, 137: municipality Woppenroth ...Show less...
The number of rooms per house (dwelling)
The number of rooms of the houses in the municipality Thörlingen
One moment please, your device is loading the charts...
Municipality Thörlingen, 2019, number of rooms per house.
The percentage shows the relative share of houses per category based on the numer of rooms: 1 to 2 rooms, 3 to 4 rooms or 5 rooms or more. This is based on the total number of rooms as identified for all dwellings in the municipality Thörlingen.
Data about more than 100 topics!
The table below shows data for more than 100 topics as most recently available for the municipality Thörlingen. Select a category to display the related topics:
| Business | Value | Unit | Year |
|---|---|---|---|
| Businesses | no data | Number | 2015 |
| Active persons | no data | Number | 2015 |
| Gross wages | no data | Euro | 2015 |
| Dwellings | Value | Unit | Year |
|---|---|---|---|
| Houses 1 room | 0 | Number | 2019 |
| Houses 2 rooms | 3 | Number | 2019 |
| Houses 3 rooms | 5 | Number | 2019 |
| Houses 4 rooms | 6 | Number | 2019 |
| Houses 5 rooms | 15 | Number | 2019 |
| Houses 6 rooms | 6 | Number | 2019 |
| Houses 7+ rooms | 26 | Number | 2019 |
| Houses 1-2 rooms | 3 | Number | 2019 |
| Houses 3-4 rooms | 11 | Number | 2019 |
| Houses 5+ rooms | 47 | Number | 2019 |
| 1-2 rooms | 5% | Percentage | 2019 |
| 3-4 rooms | 18% | Percentage | 2019 |
| 5+ rooms | 77% | Percentage | 2019 |
| Elections | Value | Unit | Year |
|---|---|---|---|
| Voters Bundestag | 107,00 | Number | 2017 |
| Voter turnout Bundestag | 86 | Number | 2017 |
| Votes valid Bundestag | 59 | Number | 2017 |
| Votes Bundestag CDU/CSU | 32 | Number | 2017 |
| Votes Bundestag SPD | 7 | Number | 2017 |
| Votes Bundestag GRÜNE | 2 | Number | 2017 |
| Votes Bundestag FDP | 7 | Number | 2017 |
| Votes Bundestag DIE LINKE | 6 | Number | 2017 |
| Votes Bundestag AfD | 5 | Number | 2017 |
| Votes Bundestag other parties | 0 | Number | 2017 |
| Votes Bundestag total | 59 | Number | 2017 |
| % Votes Bundestag CDU/CSU | 30% | Percentage | 2017 |
| % Votes Bundestag SPD | 7% | Percentage | 2017 |
| % Votes Bundestag GRÜNE | 2% | Percentage | 2017 |
| % Votes Bundestag FDP | 7% | Percentage | 2017 |
| % Votes Bundestag DIE LINKE | 6% | Percentage | 2017 |
| % Votes Bundestag AfD | 5% | Percentage | 2017 |
| % Votes Bundestag other parties | 0% | Percentage | 2017 |
| Employment | Value | Unit | Year |
|---|---|---|---|
| Employees | 46 | Number | 2019 |
| Employees male | 27 | Number | 2019 |
| Employees female | 19 | Number | 2019 |
| Employees foreigner | 0 | Number | 2019 |
| Employees male foreigner | 0 | Number | 2019 |
| Employees female foreigner | 0 | Number | 2019 |
| Unemployed | 1 | Number | 2018 |
| Unemployed foreigners | 0 | Number | 2018 |
| Unemployed severely disabled | 0 | Number | 2018 |
| Unemployed 15-20 | 0 | Number | 2018 |
| Unemployed 15-25 | 0 | Number | 2018 |
| Unemployed 55-65 | 1 | Number | 2018 |
| Unemployed long-term | 0 | Number | 2018 |
| % Unemployed | 1% | Percentage | 2018 |
| % Unemployed foreigners | 0% | Percentage of the population | 2018 |
| % Unemployed severely disabled | 0% | Percentage of the population | 2018 |
| % Unemployed 15-20 | 0% | Percentage of the population | 2018 |
| % Unemployed 15-25 | 0% | Percentage of the population | 2018 |
| % Unemployed 55-65 | 1% | Percentage of the population | 2018 |
| % Unemployed long-term | 0% | Percentage of the population | 2018 |
| Income | Value | Unit | Year |
|---|---|---|---|
| Income receivers | 63 | Number | 2015 |
| Income total | €2.515 | Euro | 2015 |
| Income tax | €445 | Euro | 2015 |
| Population | Value | Unit | Year |
|---|---|---|---|
| Population | 140 | Number | 2019 |
| Men | 76 | Number | 2019 |
| Women | 64 | Number | 2019 |
| % Men | 54% | Percentage | 2019 |
| % Women | 46% | Percentage | 2019 |
| 0-18 | 32 | Number | 2019 |
| 18-30 | 11 | Number | 2019 |
| 30-45 | 20 | Number | 2019 |
| 45-60 | 39 | Number | 2019 |
| 18-60 | 70 | Number | 2019 |
| 60-75 | 29 | Number | 2019 |
| 60+ | 38 | Number | 2019 |
| Average age | 44 | Average number | 2019 |
| Average age male | 43 | Average number | 2019 |
| Average age female | 44 | Average number | 2019 |
| Births | 1 | Number | 2018 |
| Births male | 0 | Number | 2018 |
| Births female | 1 | Number | 2018 |
| 1K Births | 7 | Number per 1000 inhabitants | 2018 |
| Deaths | 1 | Number | 2018 |
| Deaths male | 0 | Number | 2018 |
| Deaths female | 1 | Number | 2018 |
| 1K Deaths | 7 | Number | 2018 |
| 0-3 | 2 | Number | 2019 |
| Girls 0-3 | 2 | Number | 2019 |
| Boys 0-3 | 0 | Number | 2019 |
| 3-6 | 2 | Number | 2019 |
| Girls 3-6 | 2 | Number | 2019 |
| Boys 3-6 | 0 | Number | 2019 |
| 6-10 | 7 | Number | 2019 |
| 10-15 | 13 | Number | 2019 |
| 15-18 | 8 | Number | 2019 |
| 18-20 | 4 | Number | 2019 |
| 20-25 | 5 | Number | 2019 |
| 25-30 | 2 | Number | 2019 |
| 30-35 | 2 | Number | 2019 |
| 35-40 | 12 | Number | 2019 |
| 40-45 | 6 | Number | 2019 |
| 45-50 | 16 | Number | 2019 |
| 50-55 | 12 | Number | 2019 |
| 55-60 | 11 | Number | 2019 |
| 60-65 | 12 | Number | 2019 |
| 65-75 | 17 | Number | 2019 |
| Women 65-70 | 7 | Number | 2019 |
| Men 65-70 | 10 | Number | 2019 |
| 75+ | 9 | Number | 2019 |
| Women 75+ | 4 | Number | 2019 |
| Men 75+ | 5 | Number | 2019 |
| % 0-10 | 8% | Percentage | 2019 |
| % 10-18 | 15% | Percentage | 2019 |
| % 18-30 | 8% | Percentage | 2019 |
| % 30-45 | 14% | Percentage | 2019 |
| % 45-60 | 28% | Percentage | 2019 |
| % 60+ | 27% | Percentage | 2019 |
| Real estate | Value | Unit | Year |
|---|---|---|---|
| Property tax A revenue | €2.239 | Euro | 2018 |
| Property tax B revenue | €12.317 | Euro | 2018 |
| Trade tax actual revenue | €19.335 | Euro | 2018 |
| Property tax A basic amount | €678 | Euro | 2018 |
| Property tax B basic amount | €3.375 | Euro | 2018 |
| Trade tax basic amount | €5.371 | Euro | 2018 |
| Property tax A rate | €330 | Euro | 2018 |
| Property tax B rate | €365 | Euro | 2018 |
| Trade tax rate | €360 | Euro | 2018 |
| Real tax raising force | €39.835 | Euro | 2018 |
| Trade tax levy | €3.668 | Euro | 2018 |
| Trade tax net | €15.667 | Euro | 2018 |
| Community share in income tax | €62.204 | Euro | 2018 |
| Community share in sales tax | €1.383 | Euro | 2018 |
| Tax revenue | €99.754 | Euro | 2018 |
| Regional | Value | Unit | Year |
|---|---|---|---|
| Region code | 071405002149 | Code | 2019 |
| Region code 8 digits | 07140149 | Code | 07140149 |
| Sorting code | 071405002149 | Code | 071405002149 |
| Sorting code 8 digits | 07140149 | Code | 07140149 |
| Region name | Thörlingen | Name | 2019 |
| Regional level | 6 | Categorical type | 2019 |
| Region type | Municipality | Categorical type | 2019 |
| Region type detail | municipality | Categorical type | 2019 |
| Region name with type | municipality Thörlingen | Name | 2019 |
| Region name in German | Gemeinde Thörlingen | Name | 2019 |
| Direct subregions | no data | Number | 2019 |
| NUTS code | DEB1D | Code | 2019 |
| Area | 2 | Area in km² | 2019 |
| Religion | Value | Unit | Year |
|---|---|---|---|
| Roman Catholic church | 123 | Number | 2011 |
| Protestant church | 12 | Number | 2011 |
| Other or none | 18 | Number | 2011 |
| % Roman Catholic church | 80% | Percentage | 2011 |
| % Protestant church | 8% | Percentage | 2011 |
| % Other or none | 12% | Percentage | 2011 |
| Roman Catholic church German | 120 | Number | 2011 |
| Protestant church German | 12 | Number | 2011 |
| Other or none German | 15 | Number | 2011 |
| % Roman Catholic church German | 82% | Percentage | 2011 |
| % Protestant church German | 8% | Percentage | 2011 |
| % Other or none German Foreign | 10% | Percentage | 2011 |
| Roman Catholic church Foreign | 3 | Number | 2011 |
| Protestant church Foreign | 0 | Number | 2011 |
| Other or none Foreign | 3 | Number | 2011 |
| % Roman Catholic church Foreign | 50% | Percentage | 2011 |
| % Protestant church Foreign | 0% | Percentage | 2011 |
| % Other or none Foreign | 50% | Percentage | 2011 |
Open data sources used
Data is used from multiple German open data providers. See this description of the sources with the definitions of all regional topics.
Sources & definitionsUnder development
Work is in progress to add more information to this page
This page will be further expanded with more topics in clear graphs. This will be done in several iterations in the coming weeks.