One moment please, your device is loading the charts...
Population numbers in the municipality Wiesenburg/Mark for the years 2009 thru 2019.
The number of inhabitants is the number of persons as registered in the population register on January 1st.
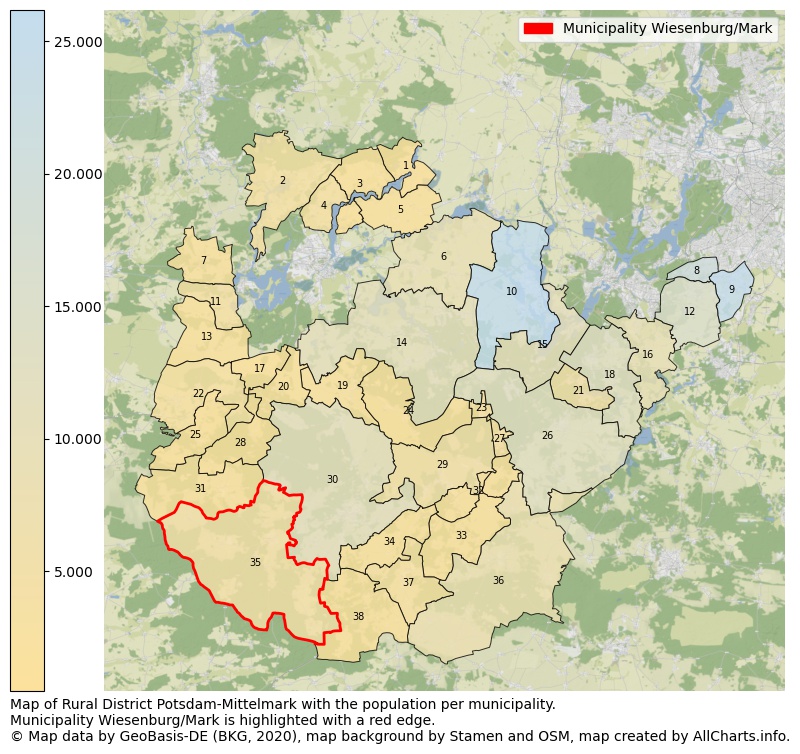
Map of Rural district Potsdam-Mittelmark with the population per municipality.Municipality Wiesenburg/Mark is highlighted with a red edge. The numbers at the map represent the following municipalities: 1: municipality Päwesin, 2: municipality city Havelsee, 3: municipality Beetzseeheide, 4: municipality Beetzsee, 5: municipality Roskow ...Show more... Map of Rural district Potsdam-Mittelmark with the population per municipality.Municipality Wiesenburg/Mark is highlighted with a red edge. The numbers at the map represent the following municipalities: 1: municipality Päwesin, 2: municipality city Havelsee, 3: municipality Beetzseeheide, 4: municipality Beetzsee, 5: municipality Roskow, 6: municipality Groß Kreutz (Havel), 7: municipality Bensdorf, 8: municipality Kleinmachnow, 9: municipality city Teltow, 10: municipality city Werder (Havel), 11: municipality Wusterwitz, 12: municipality Stahnsdorf, 13: municipality Rosenau, 14: municipality Kloster Lehnin, 15: municipality Schwielowsee, 16: municipality Nuthetal, 17: municipality Wenzlow, 18: municipality Michendorf, 19: municipality Golzow, 20: municipality Wollin, 21: municipality Seddiner See, 22: municipality city Ziesar, 23: municipality Borkwalde, 24: municipality Planebruch, 25: municipality Buckautal, 26: municipality city Beelitz, 27: municipality Borkheide, 28: municipality Gräben, 29: municipality city Brück, 30: municipality city Bad Belzig, 31: municipality Görzke, 32: municipality Linthe, 33: municipality Mühlenfließ, 34: municipality Planetal, 35: municipality Wiesenburg/Mark, 36: municipality city Treuenbrietzen, 37: municipality city Niemegk, 38: municipality Rabenstein/Fläming ...Show less...
One moment please, your device is loading the charts...
Municipality Wiesenburg/Mark, 2019, number of rooms per house.
The percentage shows the relative share of houses per category based on the numer of rooms: 1 to 2 rooms, 3 to 4 rooms or 5 rooms or more. This is based on the total number of rooms as identified for all dwellings in the municipality Wiesenburg/Mark.
The table below shows data for more than 100 topics as most recently available for the municipality Wiesenburg/Mark. Select a category to display the related topics:
| Business | Value | Unit | Year |
|---|---|---|---|
| Businesses | 4 | Number | 2017 |
| Active persons | 124 | Number | 2017 |
| Gross wages | €4.467 | Euro | 2017 |
| Dwellings | Value | Unit | Year |
|---|---|---|---|
| Houses 1 room | 15 | Number | 2019 |
| Houses 2 rooms | 112 | Number | 2019 |
| Houses 3 rooms | 376 | Number | 2019 |
| Houses 4 rooms | 473 | Number | 2019 |
| Houses 5 rooms | 492 | Number | 2019 |
| Houses 6 rooms | 367 | Number | 2019 |
| Houses 7+ rooms | 352 | Number | 2019 |
| Houses 1-2 rooms | 127 | Number | 2019 |
| Houses 3-4 rooms | 849 | Number | 2019 |
| Houses 5+ rooms | 1.211 | Number | 2019 |
| 1-2 rooms | 6% | Percentage | 2019 |
| 3-4 rooms | 39% | Percentage | 2019 |
| 5+ rooms | 55% | Percentage | 2019 |
| Elections | Value | Unit | Year |
|---|---|---|---|
| Voters Bundestag | 3684,00 | Number | 2017 |
| Voter turnout Bundestag | 73 | Number | 2017 |
| Votes valid Bundestag | 2.622 | Number | 2017 |
| Votes Bundestag CDU/CSU | 707 | Number | 2017 |
| Votes Bundestag SPD | 552 | Number | 2017 |
| Votes Bundestag GRÜNE | 129 | Number | 2017 |
| Votes Bundestag FDP | 155 | Number | 2017 |
| Votes Bundestag DIE LINKE | 472 | Number | 2017 |
| Votes Bundestag AfD | 441 | Number | 2017 |
| Votes Bundestag other parties | 166 | Number | 2017 |
| Votes Bundestag total | 2.622 | Number | 2017 |
| % Votes Bundestag CDU/CSU | 19% | Percentage | 2017 |
| % Votes Bundestag SPD | 15% | Percentage | 2017 |
| % Votes Bundestag GRÜNE | 4% | Percentage | 2017 |
| % Votes Bundestag FDP | 4% | Percentage | 2017 |
| % Votes Bundestag DIE LINKE | 13% | Percentage | 2017 |
| % Votes Bundestag AfD | 12% | Percentage | 2017 |
| % Votes Bundestag other parties | 5% | Percentage | 2017 |
| Employment | Value | Unit | Year |
|---|---|---|---|
| Employees | 1.604 | Number | 2019 |
| Employees male | 879 | Number | 2019 |
| Employees female | 725 | Number | 2019 |
| Employees foreigner | 29 | Number | 2019 |
| Employees male foreigner | 20 | Number | 2019 |
| Employees female foreigner | 9 | Number | 2019 |
| Unemployed | 194 | Number | 2018 |
| Unemployed foreigners | 9 | Number | 2018 |
| Unemployed severely disabled | 11 | Number | 2018 |
| Unemployed 15-20 | 4 | Number | 2018 |
| Unemployed 15-25 | 11 | Number | 2018 |
| Unemployed 55-65 | 68 | Number | 2018 |
| Unemployed long-term | 90 | Number | 2018 |
| % Unemployed | 5% | Percentage | 2018 |
| % Unemployed foreigners | 0% | Percentage of the population | 2018 |
| % Unemployed severely disabled | 0% | Percentage of the population | 2018 |
| % Unemployed 15-20 | 0% | Percentage of the population | 2018 |
| % Unemployed 15-25 | 0% | Percentage of the population | 2018 |
| % Unemployed 55-65 | 2% | Percentage of the population | 2018 |
| % Unemployed long-term | 2% | Percentage of the population | 2018 |
| Income | Value | Unit | Year |
|---|---|---|---|
| Income receivers | 1.939 | Number | 2015 |
| Income total | €53.511 | Euro | 2015 |
| Income tax | €6.858 | Euro | 2015 |
| Population | Value | Unit | Year |
|---|---|---|---|
| Population | 4.295 | Number | 2019 |
| Men | 2.204 | Number | 2019 |
| Women | 2.091 | Number | 2019 |
| % Men | 51% | Percentage | 2019 |
| % Women | 49% | Percentage | 2019 |
| 0-18 | 554 | Number | 2019 |
| 18-30 | 274 | Number | 2019 |
| 30-45 | 700 | Number | 2019 |
| 45-60 | 1.128 | Number | 2019 |
| 18-60 | 2.102 | Number | 2019 |
| 60-75 | 1.004 | Number | 2019 |
| 60+ | 1.639 | Number | 2019 |
| Average age | 50 | Average number | 2019 |
| Average age male | 49 | Average number | 2019 |
| Average age female | 52 | Average number | 2019 |
| Births | 19 | Number | 2018 |
| Births male | 12 | Number | 2018 |
| Births female | 7 | Number | 2018 |
| 1K Births | 4 | Number per 1000 inhabitants | 2018 |
| Deaths | 55 | Number | 2018 |
| Deaths male | 31 | Number | 2018 |
| Deaths female | 24 | Number | 2018 |
| 1K Deaths | 13 | Number | 2018 |
| 0-3 | 83 | Number | 2019 |
| Girls 0-3 | 37 | Number | 2019 |
| Boys 0-3 | 46 | Number | 2019 |
| 3-6 | 102 | Number | 2019 |
| Girls 3-6 | 46 | Number | 2019 |
| Boys 3-6 | 56 | Number | 2019 |
| 6-10 | 120 | Number | 2019 |
| 10-15 | 149 | Number | 2019 |
| 15-18 | 100 | Number | 2019 |
| 18-20 | 59 | Number | 2019 |
| 20-25 | 92 | Number | 2019 |
| 25-30 | 123 | Number | 2019 |
| 30-35 | 224 | Number | 2019 |
| 35-40 | 252 | Number | 2019 |
| 40-45 | 224 | Number | 2019 |
| 45-50 | 278 | Number | 2019 |
| 50-55 | 401 | Number | 2019 |
| 55-60 | 449 | Number | 2019 |
| 60-65 | 426 | Number | 2019 |
| 65-75 | 578 | Number | 2019 |
| Women 65-70 | 294 | Number | 2019 |
| Men 65-70 | 284 | Number | 2019 |
| 75+ | 635 | Number | 2019 |
| Women 75+ | 371 | Number | 2019 |
| Men 75+ | 264 | Number | 2019 |
| % 0-10 | 7% | Percentage | 2019 |
| % 10-18 | 6% | Percentage | 2019 |
| % 18-30 | 6% | Percentage | 2019 |
| % 30-45 | 16% | Percentage | 2019 |
| % 45-60 | 26% | Percentage | 2019 |
| % 60+ | 38% | Percentage | 2019 |
| Real estate | Value | Unit | Year |
|---|---|---|---|
| Property tax A revenue | no data | Euro | no data |
| Property tax B revenue | no data | Euro | no data |
| Trade tax actual revenue | no data | Euro | no data |
| Property tax A basic amount | no data | Euro | no data |
| Property tax B basic amount | no data | Euro | no data |
| Trade tax basic amount | no data | Euro | no data |
| Property tax A rate | no data | Euro | no data |
| Property tax B rate | no data | Euro | no data |
| Trade tax rate | no data | Euro | no data |
| Real tax raising force | no data | Euro | no data |
| Trade tax levy | no data | Euro | no data |
| Trade tax net | no data | Euro | no data |
| Community share in income tax | no data | Euro | no data |
| Community share in sales tax | no data | Euro | no data |
| Tax revenue | no data | Euro | no data |
| Regional | Value | Unit | Year |
|---|---|---|---|
| Region code | 120690665665 | Code | 2019 |
| Region code 8 digits | 12069665 | Code | 12069665 |
| Sorting code | 120690665665 | Code | 120690665665 |
| Sorting code 8 digits | 12069665 | Code | 12069665 |
| Region name | Wiesenburg/Mark | Name | 2019 |
| Regional level | 6 | Categorical type | 2019 |
| Region type | Municipality | Categorical type | 2019 |
| Region type detail | municipality | Categorical type | 2019 |
| Region name with type | municipality Wiesenburg/Mark | Name | 2019 |
| Region name in German | Gemeinde Wiesenburg/Mark | Name | 2019 |
| Direct subregions | no data | Number | 2019 |
| NUTS code | DE40E | Code | 2019 |
| Area | 220 | Area in km² | 2019 |
| Religion | Value | Unit | Year |
|---|---|---|---|
| Roman Catholic church | 116 | Number | 2011 |
| Protestant church | 980 | Number | 2011 |
| Other or none | 3.488 | Number | 2011 |
| % Roman Catholic church | 3% | Percentage | 2011 |
| % Protestant church | 21% | Percentage | 2011 |
| % Other or none | 76% | Percentage | 2011 |
| Roman Catholic church German | 113 | Number | 2011 |
| Protestant church German | 977 | Number | 2011 |
| Other or none German | 3.469 | Number | 2011 |
| % Roman Catholic church German | 2% | Percentage | 2011 |
| % Protestant church German | 21% | Percentage | 2011 |
| % Other or none German Foreign | 76% | Percentage | 2011 |
| Roman Catholic church Foreign | 3 | Number | 2011 |
| Protestant church Foreign | 3 | Number | 2011 |
| Other or none Foreign | 19 | Number | 2011 |
| % Roman Catholic church Foreign | 12% | Percentage | 2011 |
| % Protestant church Foreign | 12% | Percentage | 2011 |
| % Other or none Foreign | 76% | Percentage | 2011 |
Data is used from multiple German open data providers. See this description of the sources with the definitions of all regional topics.
Sources & definitionsThis page will be further expanded with more topics in clear graphs. This will be done in several iterations in the coming weeks.
![]()
© Published:
 Contents and more information: