Population numbers per year
The number of inhabitants in the rural district Mainz-Bingen
One moment please, your device is loading the charts...
Population numbers in the rural district Mainz-Bingen for the years 2009 thru 2019.
The number of inhabitants is the number of persons as registered in the population register on January 1st.
Population at the map of Mainz-Bingen
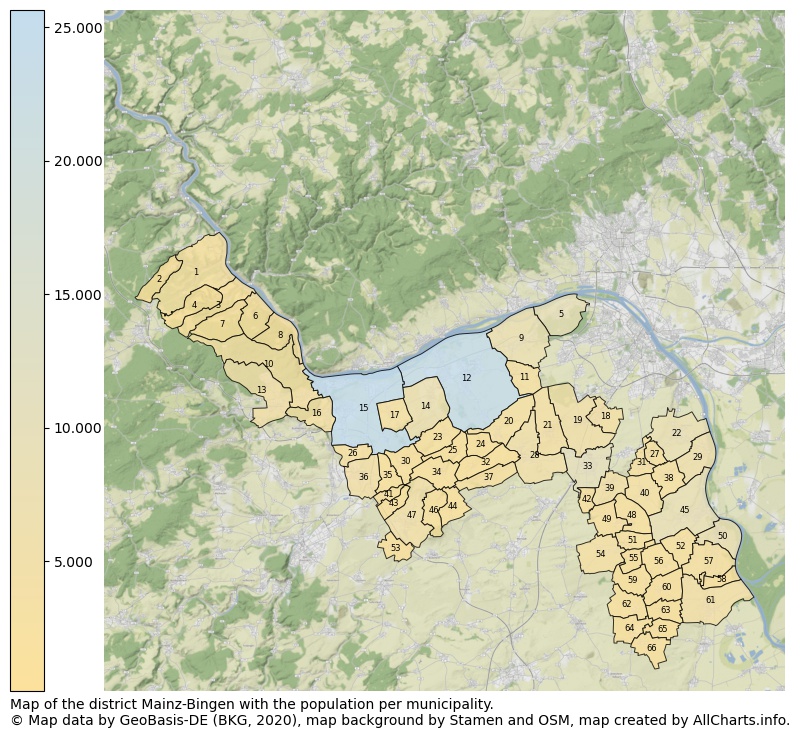
Map of the district Mainz-Bingen with the population per municipality. The numbers at the map represent the following municipalities: 1: municipality city Bacharach, 2: municipality Breitscheid, 3: municipality Oberdiebach, 4: municipality Manubach, 5: municipality Budenheim ...Show more... Map of the district Mainz-Bingen with the population per municipality. The numbers at the map represent the following municipalities: 1: municipality city Bacharach, 2: municipality Breitscheid, 3: municipality Oberdiebach, 4: municipality Manubach, 5: municipality Budenheim, 6: municipality Niederheimbach, 7: municipality Oberheimbach, 8: municipality Trechtingshausen, 9: municipality Heidesheim am Rhein, 10: municipality Weiler bei Bingen, 11: municipality Wackernheim, 12: municipality city Ingelheim am Rhein, 13: municipality Waldalgesheim, 14: municipality city Gau-Algesheim, 15: municipality city Bingen am Rhein, 16: municipality Münster-Sarmsheim, 17: municipality Ockenheim, 18: municipality Klein-Winternheim, 19: municipality Ober-Olm, 20: municipality Schwabenheim an der Selz, 21: municipality Essenheim, 22: municipality Bodenheim, 23: municipality Appenheim, 24: municipality Bubenheim, 25: municipality Nieder-Hilbersheim, 26: municipality Grolsheim, 27: municipality Gau-Bischofsheim, 28: municipality Stadecken-Elsheim, 29: municipality Nackenheim, 30: municipality Aspisheim, 31: municipality Harxheim, 32: municipality Engelstadt, 33: municipality city Nieder-Olm, 34: municipality Ober-Hilbersheim, 35: municipality Horrweiler, 36: municipality Gensingen, 37: municipality Jugenheim in Rheinhessen, 38: municipality Lörzweiler, 39: municipality Zornheim, 40: municipality Mommenheim, 41: municipality Welgesheim, 42: municipality Sörgenloch, 43: municipality Zotzenheim, 44: municipality Wolfsheim, 45: municipality city Nierstein, 46: municipality Sankt Johann, 47: municipality Sprendlingen, 48: municipality Selzen, 49: municipality Hahnheim, 50: municipality city Oppenheim, 51: municipality Köngernheim, 52: municipality Dexheim, 53: municipality Badenheim, 54: municipality Undenheim, 55: municipality Friesenheim, 56: municipality Dalheim, 57: municipality Dienheim, 58: municipality Ludwigshöhe, 59: municipality Weinolsheim, 60: municipality Uelversheim, 61: municipality Guntersblum, 62: municipality Dolgesheim, 63: municipality Eimsheim, 64: municipality Hillesheim, 65: municipality Wintersheim, 66: municipality Dorn-Dürkheim ...Show less...
The number of rooms per house (dwelling)
The number of rooms of the houses in the rural district Mainz-Bingen
One moment please, your device is loading the charts...
Rural district Mainz-Bingen, 2019, number of rooms per house.
The percentage shows the relative share of houses per category based on the numer of rooms: 1 to 2 rooms, 3 to 4 rooms or 5 rooms or more. This is based on the total number of rooms as identified for all dwellings in the rural district Mainz-Bingen.
Data about more than 100 topics!
The table below shows data for more than 100 topics as most recently available for the rural district Mainz-Bingen. Select a category to display the related topics:
| Business | Value | Unit | Year |
|---|---|---|---|
| Businesses | 61 | Number | 2017 |
| Active persons | 12.701 | Number | 2017 |
| Gross wages | €793.012 | Euro | 2017 |
| Dwellings | Value | Unit | Year |
|---|---|---|---|
| Houses 1 room | 2.860 | Number | 2019 |
| Houses 2 rooms | 7.172 | Number | 2019 |
| Houses 3 rooms | 16.322 | Number | 2019 |
| Houses 4 rooms | 21.034 | Number | 2019 |
| Houses 5 rooms | 19.690 | Number | 2019 |
| Houses 6 rooms | 16.556 | Number | 2019 |
| Houses 7+ rooms | 20.571 | Number | 2019 |
| Houses 1-2 rooms | 10.032 | Number | 2019 |
| Houses 3-4 rooms | 37.356 | Number | 2019 |
| Houses 5+ rooms | 56.817 | Number | 2019 |
| 1-2 rooms | 10% | Percentage | 2019 |
| 3-4 rooms | 36% | Percentage | 2019 |
| 5+ rooms | 55% | Percentage | 2019 |
| Elections | Value | Unit | Year |
|---|---|---|---|
| Voters Bundestag | 158824,00 | Number | 2017 |
| Voter turnout Bundestag | 83 | Number | 2017 |
| Votes valid Bundestag | 129.998 | Number | 2017 |
| Votes Bundestag CDU/CSU | 46.056 | Number | 2017 |
| Votes Bundestag SPD | 29.983 | Number | 2017 |
| Votes Bundestag GRÜNE | 12.973 | Number | 2017 |
| Votes Bundestag FDP | 14.928 | Number | 2017 |
| Votes Bundestag DIE LINKE | 8.604 | Number | 2017 |
| Votes Bundestag AfD | 12.735 | Number | 2017 |
| Votes Bundestag other parties | 4.719 | Number | 2017 |
| Votes Bundestag total | 129.998 | Number | 2017 |
| % Votes Bundestag CDU/CSU | 29% | Percentage | 2017 |
| % Votes Bundestag SPD | 19% | Percentage | 2017 |
| % Votes Bundestag GRÜNE | 8% | Percentage | 2017 |
| % Votes Bundestag FDP | 9% | Percentage | 2017 |
| % Votes Bundestag DIE LINKE | 5% | Percentage | 2017 |
| % Votes Bundestag AfD | 8% | Percentage | 2017 |
| % Votes Bundestag other parties | 3% | Percentage | 2017 |
| Employment | Value | Unit | Year |
|---|---|---|---|
| Employees | 85.888 | Number | 2019 |
| Employees male | 45.117 | Number | 2019 |
| Employees female | 40.771 | Number | 2019 |
| Employees foreigner | 8.958 | Number | 2019 |
| Employees male foreigner | 5.632 | Number | 2019 |
| Employees female foreigner | 3.326 | Number | 2019 |
| Unemployed | 3.946 | Number | 2018 |
| Unemployed foreigners | 1.053 | Number | 2018 |
| Unemployed severely disabled | 239 | Number | 2018 |
| Unemployed 15-20 | 109 | Number | 2018 |
| Unemployed 15-25 | 475 | Number | 2018 |
| Unemployed 55-65 | 824 | Number | 2018 |
| Unemployed long-term | 974 | Number | 2018 |
| % Unemployed | 2% | Percentage | 2018 |
| % Unemployed foreigners | 0% | Percentage of the population | 2018 |
| % Unemployed severely disabled | 0% | Percentage of the population | 2018 |
| % Unemployed 15-20 | 0% | Percentage of the population | 2018 |
| % Unemployed 15-25 | 0% | Percentage of the population | 2018 |
| % Unemployed 55-65 | 0% | Percentage of the population | 2018 |
| % Unemployed long-term | 0% | Percentage of the population | 2018 |
| Income | Value | Unit | Year |
|---|---|---|---|
| Income receivers | 105.287 | Number | 2015 |
| Income total | €4.921.979 | Euro | 2015 |
| Income tax | €950.854 | Euro | 2015 |
| Population | Value | Unit | Year |
|---|---|---|---|
| Population | 210.889 | Number | 2019 |
| Men | 104.015 | Number | 2019 |
| Women | 106.874 | Number | 2019 |
| % Men | 49% | Percentage | 2019 |
| % Women | 51% | Percentage | 2019 |
| 0-18 | 36.516 | Number | 2019 |
| 18-30 | 25.710 | Number | 2019 |
| 30-45 | 37.190 | Number | 2019 |
| 45-60 | 53.067 | Number | 2019 |
| 18-60 | 115.967 | Number | 2019 |
| 60-75 | 36.718 | Number | 2019 |
| 60+ | 58.406 | Number | 2019 |
| Average age | 44 | Average number | 2019 |
| Average age male | 43 | Average number | 2019 |
| Average age female | 46 | Average number | 2019 |
| Births | 1.880 | Number | 2018 |
| Births male | 999 | Number | 2018 |
| Births female | 881 | Number | 2018 |
| 1K Births | 9 | Number per 1000 inhabitants | 2018 |
| Deaths | 2.011 | Number | 2018 |
| Deaths male | 973 | Number | 2018 |
| Deaths female | 1.038 | Number | 2018 |
| 1K Deaths | 10 | Number | 2018 |
| 0-3 | 5.945 | Number | 2019 |
| Girls 0-3 | 2.833 | Number | 2019 |
| Boys 0-3 | 3.112 | Number | 2019 |
| 3-6 | 6.106 | Number | 2019 |
| Girls 3-6 | 3.006 | Number | 2019 |
| Boys 3-6 | 3.100 | Number | 2019 |
| 6-10 | 7.982 | Number | 2019 |
| 10-15 | 10.117 | Number | 2019 |
| 15-18 | 6.366 | Number | 2019 |
| 18-20 | 4.540 | Number | 2019 |
| 20-25 | 10.435 | Number | 2019 |
| 25-30 | 10.735 | Number | 2019 |
| 30-35 | 11.402 | Number | 2019 |
| 35-40 | 12.975 | Number | 2019 |
| 40-45 | 12.813 | Number | 2019 |
| 45-50 | 15.472 | Number | 2019 |
| 50-55 | 19.385 | Number | 2019 |
| 55-60 | 18.210 | Number | 2019 |
| 60-65 | 14.780 | Number | 2019 |
| 65-75 | 21.938 | Number | 2019 |
| Women 65-70 | 11.292 | Number | 2019 |
| Men 65-70 | 10.646 | Number | 2019 |
| 75+ | 21.688 | Number | 2019 |
| Women 75+ | 12.513 | Number | 2019 |
| Men 75+ | 9.175 | Number | 2019 |
| % 0-10 | 9% | Percentage | 2019 |
| % 10-18 | 8% | Percentage | 2019 |
| % 18-30 | 12% | Percentage | 2019 |
| % 30-45 | 18% | Percentage | 2019 |
| % 45-60 | 25% | Percentage | 2019 |
| % 60+ | 28% | Percentage | 2019 |
| Real estate | Value | Unit | Year |
|---|---|---|---|
| Property tax A revenue | no data | Euro | no data |
| Property tax B revenue | no data | Euro | no data |
| Trade tax actual revenue | no data | Euro | no data |
| Property tax A basic amount | no data | Euro | no data |
| Property tax B basic amount | no data | Euro | no data |
| Trade tax basic amount | no data | Euro | no data |
| Property tax A rate | €301 | Euro | 2018 |
| Property tax B rate | no data | Euro | no data |
| Trade tax rate | no data | Euro | no data |
| Real tax raising force | no data | Euro | no data |
| Trade tax levy | €97.147.083 | Euro | 2018 |
| Trade tax net | €361.996.249 | Euro | 2018 |
| Community share in income tax | no data | Euro | no data |
| Community share in sales tax | no data | Euro | no data |
| Tax revenue | no data | Euro | no data |
| Regional | Value | Unit | Year |
|---|---|---|---|
| Region code | 07339 | Code | 2019 |
| Region code 8 digits | 07339 | Code | 07339 |
| Sorting code | 073390000000 | Code | 073390000000 |
| Sorting code 8 digits | 07339000 | Code | 07339000 |
| Region name | Mainz-Bingen | Name | 2019 |
| Regional level | 4 | Categorical type | 2019 |
| Region type | District | Categorical type | 2019 |
| Region type detail | rural district | Categorical type | 2019 |
| Region name with type | rural district Mainz-Bingen | Name | 2019 |
| Region name in German | Landkreis Mainz-Bingen | Name | 2019 |
| Direct subregions | 66 | Number | 2019 |
| NUTS code | DEB3J | Code | 2019 |
| Area | 605 | Area in km² | 2019 |
| Religion | Value | Unit | Year |
|---|---|---|---|
| Roman Catholic church | 77.693 | Number | 2011 |
| Protestant church | 63.918 | Number | 2011 |
| Other or none | 59.061 | Number | 2011 |
| % Roman Catholic church | 39% | Percentage | 2011 |
| % Protestant church | 32% | Percentage | 2011 |
| % Other or none | 29% | Percentage | 2011 |
| Roman Catholic church German | 72.962 | Number | 2011 |
| Protestant church German | 63.481 | Number | 2011 |
| Other or none German | 52.260 | Number | 2011 |
| % Roman Catholic church German | 39% | Percentage | 2011 |
| % Protestant church German | 34% | Percentage | 2011 |
| % Other or none German Foreign | 28% | Percentage | 2011 |
| Roman Catholic church Foreign | 4.731 | Number | 2011 |
| Protestant church Foreign | 437 | Number | 2011 |
| Other or none Foreign | 6.801 | Number | 2011 |
| % Roman Catholic church Foreign | 40% | Percentage | 2011 |
| % Protestant church Foreign | 4% | Percentage | 2011 |
| % Other or none Foreign | 57% | Percentage | 2011 |
Open data sources used
Data is used from multiple German open data providers. See this description of the sources with the definitions of all regional topics.
Sources & definitionsUnder development
Work is in progress to add more information to this page
This page will be further expanded with more topics in clear graphs. This will be done in several iterations in the coming weeks.