One moment please, your device is loading the charts...
Population numbers in the rural district Erlangen-Höchstadt for the years 2009 thru 2019.
The number of inhabitants is the number of persons as registered in the population register on January 1st.
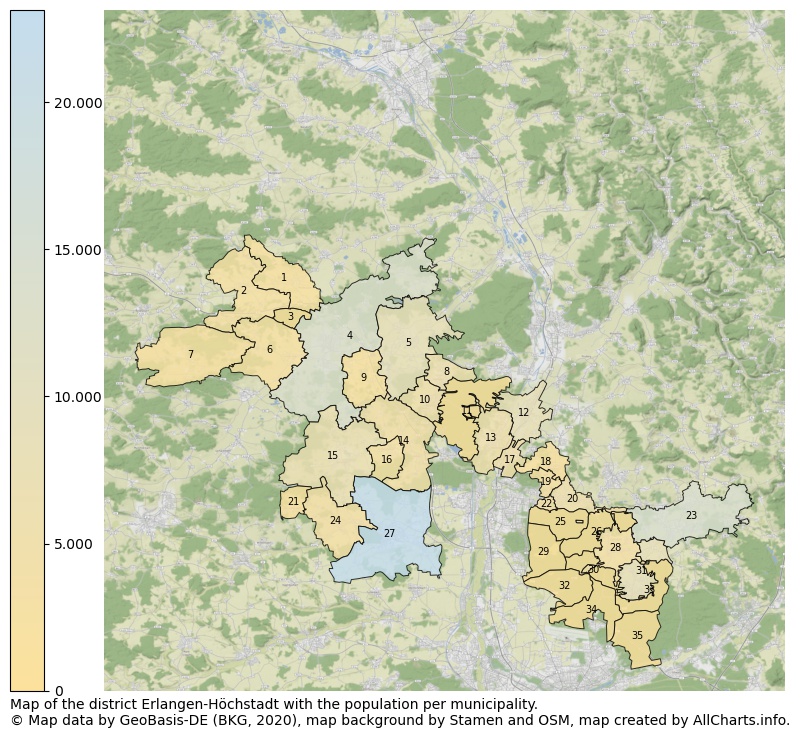
Map of the district Erlangen-Höchstadt with the population per municipality. The numbers at the map represent the following municipalities: 1: municipality Mühlhausen, 2: municipality Wachenroth, 3: unincorporated area Birkach, 4: municipality city Höchstadt a.d. Aisch, 5: municipality Adelsdorf ...Show more... Map of the district Erlangen-Höchstadt with the population per municipality. The numbers at the map represent the following municipalities: 1: municipality Mühlhausen, 2: municipality Wachenroth, 3: unincorporated area Birkach, 4: municipality city Höchstadt a.d. Aisch, 5: municipality Adelsdorf, 6: municipality Lonnerstadt, 7: municipality Vestenbergsgreuth, 8: municipality Hemhofen, 9: municipality Gremsdorf, 10: municipality Röttenbach, 11: unincorporated area Mark, 12: municipality city Baiersdorf, 13: municipality Möhrendorf, 14: municipality Heßdorf, 15: municipality Weisendorf, 16: municipality Großenseebach, 17: municipality Bubenreuth, 18: municipality Marloffstein, 19: municipality Spardorf, 20: municipality Uttenreuth, 21: municipality Oberreichenbach, 22: municipality Buckenhof, 23: municipality Eckental, 24: municipality Aurachtal, 25: unincorporated area Buckenhofer Forst, 26: unincorporated area Dormitzer Forst, 27: municipality city Herzogenaurach, 28: municipality Kalchreuth, 29: unincorporated area Forst Tennenlohe, 30: unincorporated area Kalchreuther Forst, 31: municipality Heroldsberg, 32: unincorporated area Neunhofer Forst, 33: unincorporated area Geschaidt, 34: unincorporated area Kraftshofer Forst, 35: unincorporated area Erlenstegener Forst ...Show less...
One moment please, your device is loading the charts...
Rural district Erlangen-Höchstadt, 2019, number of rooms per house.
The percentage shows the relative share of houses per category based on the numer of rooms: 1 to 2 rooms, 3 to 4 rooms or 5 rooms or more. This is based on the total number of rooms as identified for all dwellings in the rural district Erlangen-Höchstadt.
The table below shows data for more than 100 topics as most recently available for the rural district Erlangen-Höchstadt. Select a category to display the related topics:
| Business | Value | Unit | Year |
|---|---|---|---|
| Businesses | 55 | Number | 2017 |
| Active persons | 25.421 | Number | 2017 |
| Gross wages | €1.149.299 | Euro | 2017 |
| Dwellings | Value | Unit | Year |
|---|---|---|---|
| Houses 1 room | 1.053 | Number | 2019 |
| Houses 2 rooms | 3.144 | Number | 2019 |
| Houses 3 rooms | 8.207 | Number | 2019 |
| Houses 4 rooms | 13.299 | Number | 2019 |
| Houses 5 rooms | 13.533 | Number | 2019 |
| Houses 6 rooms | 11.433 | Number | 2019 |
| Houses 7+ rooms | 12.853 | Number | 2019 |
| Houses 1-2 rooms | 4.197 | Number | 2019 |
| Houses 3-4 rooms | 21.506 | Number | 2019 |
| Houses 5+ rooms | 37.819 | Number | 2019 |
| 1-2 rooms | 7% | Percentage | 2019 |
| 3-4 rooms | 34% | Percentage | 2019 |
| 5+ rooms | 60% | Percentage | 2019 |
| Elections | Value | Unit | Year |
|---|---|---|---|
| Voters Bundestag | 103450,00 | Number | 2017 |
| Voter turnout Bundestag | 83 | Number | 2017 |
| Votes valid Bundestag | 85.475 | Number | 2017 |
| Votes Bundestag CDU/CSU | 32.810 | Number | 2017 |
| Votes Bundestag SPD | 14.581 | Number | 2017 |
| Votes Bundestag GRÜNE | 9.806 | Number | 2017 |
| Votes Bundestag FDP | 8.404 | Number | 2017 |
| Votes Bundestag DIE LINKE | 5.336 | Number | 2017 |
| Votes Bundestag AfD | 8.971 | Number | 2017 |
| Votes Bundestag other parties | 5.567 | Number | 2017 |
| Votes Bundestag total | 85.475 | Number | 2017 |
| % Votes Bundestag CDU/CSU | 32% | Percentage | 2017 |
| % Votes Bundestag SPD | 14% | Percentage | 2017 |
| % Votes Bundestag GRÜNE | 9% | Percentage | 2017 |
| % Votes Bundestag FDP | 8% | Percentage | 2017 |
| % Votes Bundestag DIE LINKE | 5% | Percentage | 2017 |
| % Votes Bundestag AfD | 9% | Percentage | 2017 |
| % Votes Bundestag other parties | 5% | Percentage | 2017 |
| Employment | Value | Unit | Year |
|---|---|---|---|
| Employees | 60.180 | Number | 2019 |
| Employees male | 32.491 | Number | 2019 |
| Employees female | 27.689 | Number | 2019 |
| Employees foreigner | 5.717 | Number | 2019 |
| Employees male foreigner | 3.517 | Number | 2019 |
| Employees female foreigner | 2.200 | Number | 2019 |
| Unemployed | 1.478 | Number | 2018 |
| Unemployed foreigners | 300 | Number | 2018 |
| Unemployed severely disabled | 166 | Number | 2018 |
| Unemployed 15-20 | 28 | Number | 2018 |
| Unemployed 15-25 | 145 | Number | 2018 |
| Unemployed 55-65 | 436 | Number | 2018 |
| Unemployed long-term | 284 | Number | 2018 |
| % Unemployed | 1% | Percentage | 2018 |
| % Unemployed foreigners | 0% | Percentage of the population | 2018 |
| % Unemployed severely disabled | 0% | Percentage of the population | 2018 |
| % Unemployed 15-20 | 0% | Percentage of the population | 2018 |
| % Unemployed 15-25 | 0% | Percentage of the population | 2018 |
| % Unemployed 55-65 | 0% | Percentage of the population | 2018 |
| % Unemployed long-term | 0% | Percentage of the population | 2018 |
| Income | Value | Unit | Year |
|---|---|---|---|
| Income receivers | 68.565 | Number | 2015 |
| Income total | €3.290.017 | Euro | 2015 |
| Income tax | €644.948 | Euro | 2015 |
| Population | Value | Unit | Year |
|---|---|---|---|
| Population | 136.271 | Number | 2019 |
| Men | 67.763 | Number | 2019 |
| Women | 68.508 | Number | 2019 |
| % Men | 50% | Percentage | 2019 |
| % Women | 50% | Percentage | 2019 |
| 0-18 | 24.015 | Number | 2019 |
| 18-30 | 16.742 | Number | 2019 |
| 30-45 | 25.464 | Number | 2019 |
| 45-60 | 32.678 | Number | 2019 |
| 18-60 | 74.884 | Number | 2019 |
| 60-75 | 23.575 | Number | 2019 |
| 60+ | 37.372 | Number | 2019 |
| Average age | 44 | Average number | 2019 |
| Average age male | 43 | Average number | 2019 |
| Average age female | 45 | Average number | 2019 |
| Births | 1.270 | Number | 2018 |
| Births male | 671 | Number | 2018 |
| Births female | 599 | Number | 2018 |
| 1K Births | 9 | Number per 1000 inhabitants | 2018 |
| Deaths | 1.301 | Number | 2018 |
| Deaths male | 669 | Number | 2018 |
| Deaths female | 632 | Number | 2018 |
| 1K Deaths | 10 | Number | 2018 |
| 0-3 | 4.089 | Number | 2019 |
| Girls 0-3 | 1.972 | Number | 2019 |
| Boys 0-3 | 2.117 | Number | 2019 |
| 3-6 | 4.163 | Number | 2019 |
| Girls 3-6 | 2.018 | Number | 2019 |
| Boys 3-6 | 2.145 | Number | 2019 |
| 6-10 | 5.231 | Number | 2019 |
| 10-15 | 6.500 | Number | 2019 |
| 15-18 | 4.032 | Number | 2019 |
| 18-20 | 2.873 | Number | 2019 |
| 20-25 | 6.824 | Number | 2019 |
| 25-30 | 7.045 | Number | 2019 |
| 30-35 | 8.027 | Number | 2019 |
| 35-40 | 9.073 | Number | 2019 |
| 40-45 | 8.364 | Number | 2019 |
| 45-50 | 9.649 | Number | 2019 |
| 50-55 | 11.671 | Number | 2019 |
| 55-60 | 11.358 | Number | 2019 |
| 60-65 | 9.586 | Number | 2019 |
| 65-75 | 13.989 | Number | 2019 |
| Women 65-70 | 7.120 | Number | 2019 |
| Men 65-70 | 6.869 | Number | 2019 |
| 75+ | 13.797 | Number | 2019 |
| Women 75+ | 7.799 | Number | 2019 |
| Men 75+ | 5.998 | Number | 2019 |
| % 0-10 | 10% | Percentage | 2019 |
| % 10-18 | 8% | Percentage | 2019 |
| % 18-30 | 12% | Percentage | 2019 |
| % 30-45 | 19% | Percentage | 2019 |
| % 45-60 | 24% | Percentage | 2019 |
| % 60+ | 27% | Percentage | 2019 |
| Real estate | Value | Unit | Year |
|---|---|---|---|
| Property tax A revenue | no data | Euro | no data |
| Property tax B revenue | no data | Euro | no data |
| Trade tax actual revenue | no data | Euro | no data |
| Property tax A basic amount | no data | Euro | no data |
| Property tax B basic amount | no data | Euro | no data |
| Trade tax basic amount | no data | Euro | no data |
| Property tax A rate | no data | Euro | no data |
| Property tax B rate | no data | Euro | no data |
| Trade tax rate | no data | Euro | no data |
| Real tax raising force | no data | Euro | no data |
| Trade tax levy | no data | Euro | no data |
| Trade tax net | no data | Euro | no data |
| Community share in income tax | no data | Euro | no data |
| Community share in sales tax | no data | Euro | no data |
| Tax revenue | no data | Euro | no data |
| Regional | Value | Unit | Year |
|---|---|---|---|
| Region code | 09572 | Code | 2019 |
| Region code 8 digits | 09572 | Code | 09572 |
| Sorting code | 095720000000 | Code | 095720000000 |
| Sorting code 8 digits | 09572000 | Code | 09572000 |
| Region name | Erlangen-Höchstadt | Name | 2019 |
| Regional level | 4 | Categorical type | 2019 |
| Region type | District | Categorical type | 2019 |
| Region type detail | rural district | Categorical type | 2019 |
| Region name with type | rural district Erlangen-Höchstadt | Name | 2019 |
| Region name in German | Landkreis Erlangen-Höchstadt | Name | 2019 |
| Direct subregions | 35 | Number | 2019 |
| NUTS code | DE257 | Code | 2019 |
| Area | 565 | Area in km² | 2019 |
| Religion | Value | Unit | Year |
|---|---|---|---|
| Roman Catholic church | 53.566 | Number | 2011 |
| Protestant church | 46.544 | Number | 2011 |
| Other or none | 30.285 | Number | 2011 |
| % Roman Catholic church | 41% | Percentage | 2011 |
| % Protestant church | 36% | Percentage | 2011 |
| % Other or none | 23% | Percentage | 2011 |
| Roman Catholic church German | 51.686 | Number | 2011 |
| Protestant church German | 46.221 | Number | 2011 |
| Other or none German | 25.956 | Number | 2011 |
| % Roman Catholic church German | 42% | Percentage | 2011 |
| % Protestant church German | 37% | Percentage | 2011 |
| % Other or none German Foreign | 21% | Percentage | 2011 |
| Roman Catholic church Foreign | 1.880 | Number | 2011 |
| Protestant church Foreign | 323 | Number | 2011 |
| Other or none Foreign | 4.329 | Number | 2011 |
| % Roman Catholic church Foreign | 29% | Percentage | 2011 |
| % Protestant church Foreign | 5% | Percentage | 2011 |
| % Other or none Foreign | 66% | Percentage | 2011 |
Data is used from multiple German open data providers. See this description of the sources with the definitions of all regional topics.
Sources & definitionsThis page will be further expanded with more topics in clear graphs. This will be done in several iterations in the coming weeks.
![]()
© Published:
 Contents and more information: