There is not enough data available for this region to generate the charts.
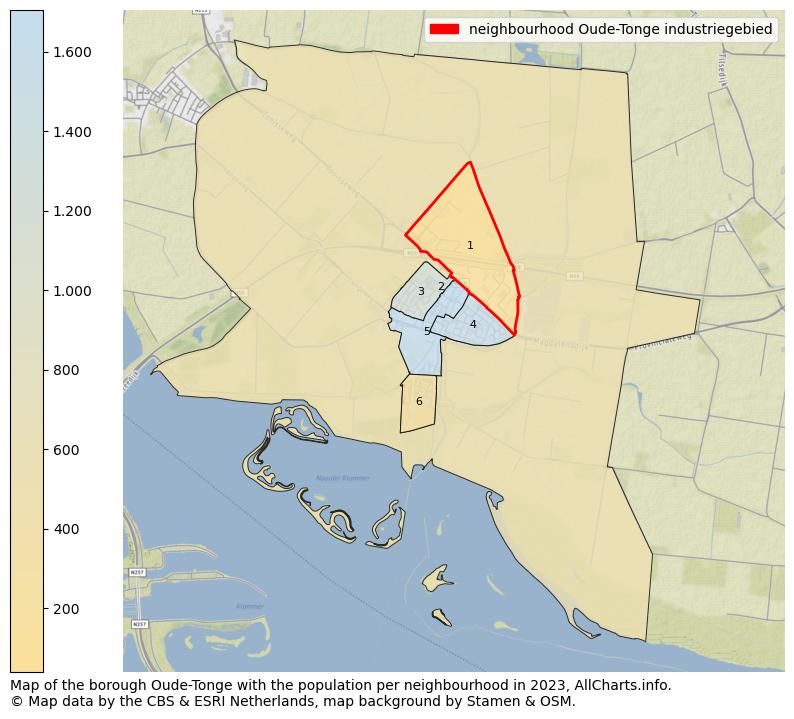
Map of the borough Oude-Tonge with the population per neighbourhood in 2023. The numbers at the map represent the following neighbourhoods: 1: Oude-Tonge industriegebied, 2: Oude-Tonge buitengebied, 3: Oude-Tonge planetenbuurt, 4: Oude-Tonge centrum, 5: Oude-Tonge prinsessenbuurt handelskade, 6: Oude-Tonge haven.
The table below shows data for more than 100 topics as most recently available for neighbourhood Oude-Tonge industriegebied in Goeree-Overflakkee in the Netherlands. Select a category to display the related topics:
| Business | Value | Unit | Year |
|---|---|---|---|
| Businesses total | 120 | number | 2022 |
| Businesses agricultural forestry fishing | 5 | number | 2022 |
| Businesses industry energy | 25 | number | 2022 |
| Businesses trade catering | 30 | number | 2022 |
| Businesses traffic information communications | 5 | number | 2022 |
| Businesses financial service real estate | 10 | number | 2022 |
| Businesses business services | 20 | number | 2022 |
| Government, education, care | 10 | number | 2022 |
| Businesses culture recreation other services | 10 | number | 2022 |
| Energy | Value | Unit | Year |
|---|---|---|---|
| Average electricity usage total | 4.280 | average kWh | 2021 |
| Average electricity usage appartment | no data | average kWh | no data |
| Average electricity usage terraced homes | no data | average kWh | no data |
| Average electricity usage corner homes | no data | average kWh | no data |
| Average electricity usage 2 under 1 roof homes | no data | average kWh | no data |
| Average electricity usage detached homes | 4.330 | average kWh | 2021 |
| Average electricity usage rental homes | no data | average kWh | no data |
| Average electricity owner-occupied homes | 4.350 | average kWh | 2021 |
| Average natural gas usage total | 1.850 | average m³ | 2021 |
| Average natural gas usage appartment | no data | average m³ | no data |
| Average natural gas usage terraced homes | no data | average m³ | no data |
| Average natural gas usage corner homes | no data | average m³ | no data |
| Average natural gas usage 2 under 1 roof homes | no data | average m³ | no data |
| Average natural gas usage detached homes | 1.750 | average m³ | 2021 |
| Average natural gas usage rental homes | no data | average m³ | no data |
| Average natural gas owner-occupied homes | 1.870 | average m³ | 2021 |
| Percentage homes with district heating | no data | percentage | no data |
| Households | Value | Unit | Year |
|---|---|---|---|
| Households | 15 | number | 2023 |
| Households 1 person | 0 | number | 2023 |
| Households no children | 10 | number | 2023 |
| Households with children | 5 | number | 2023 |
| Households average size | 2,60 | average | 2023 |
| Houses | Value | Unit | Year |
|---|---|---|---|
| Number of houses | 16 | number | 2022 |
| Average house value | no data | Euro | no data |
| Percentage single-family houses | no data | percentage | no data |
| Percentage multi-family houses | no data | percentage | no data |
| Percentage inhabited | no data | percentage | no data |
| Percentage homes uninhabited | no data | percentage | no data |
| Percentage homes private owned | no data | percentage | no data |
| Percentage homes rented | no data | percentage | no data |
| Percentage rental-housing by a corporation | no data | percentage | no data |
| Percentage homes other rental | no data | percentage | no data |
| Homes ownership unknown | no data | percentage | no data |
| Percentage homes built before 2000 | no data | percentage | no data |
| Percentage homes built since 2000 | no data | percentage | no data |
| Income | Value | Unit | Year |
|---|---|---|---|
| Number of income receivers | 0 | number | 2021 |
| Average income per income receipient | no data | Euro | no data |
| Average income per inhabitant | no data | Euro | no data |
| 40 percentile persons with lowest income | no data | percentage | no data |
| 20 percentile persons with highest income | no data | percentage | no data |
| Active persons 15-75 year | no data | percentage | no data |
| 40 percentile households with lowest income | no data | percentage | no data |
| 20 percentile households with highest income | no data | percentage | no data |
| Percentage households with a low income | no data | percentage | no data |
| Percentage households at social minimum | no data | percentage | no data |
| Persons with social security welfare | 0 | number | 2019 |
| Persons with social security for incapacity for work | 0 | number | 2019 |
| Persons with social security for unemployed | 0 | number | 2019 |
| Persons with social security for elderly | 10 | number | 2019 |
| Migration | Value | Unit | Year |
|---|---|---|---|
| Native Dutch | 40 | number | 2022 |
| Western total | 0 | number | 2022 |
| Not western total | 0 | number | 2022 |
| Marcocco | 0 | number | 2022 |
| Dutch Antilles | 0 | number | 2022 |
| Surinam | 0 | number | 2022 |
| Turkey | 0 | number | 2022 |
| Other not western | 0 | number | 2022 |
| Population | Value | Unit | Year |
|---|---|---|---|
| Inhabitants | 40 | number | 2023 |
| Men | 25 | number | 2023 |
| Women | 15 | number | 2023 |
| Ages 0 - 15 | 10 | number | 2023 |
| Ages 15 - 25 | 5 | number | 2023 |
| Ages 25 - 45 | 5 | number | 2023 |
| Ages 45 - 65 | 10 | number | 2023 |
| Ages 65 and up | 15 | number | 2023 |
| Not married | 15 | number | 2023 |
| Married | 20 | number | 2023 |
| Divorced | 10 | number | 2023 |
| Widowed | 0 | number | 2023 |
| Births | 0 | number | 2021 |
| Births relative | 24 | number per 1000 inhabitants | 2021 |
| Mortality | 0 | number | 2021 |
| Mortality relative | 0 | number per 1000 inhabitants | 2021 |
| Crime theft | 10 | number per 1000 inhabitants | 2022 |
| Crime violance and sexual abuse | 0 | number per 1000 inhabitants | 2022 |
| Crime environmental | 0 | number per 1000 inhabitants | 2022 |
| Crime scam | 1 | number per 1000 inhabitants | 2022 |
| Crime traffic | 6 | number per 1000 inhabitants | 2022 |
| Crime destruction | 0 | number per 1000 inhabitants | 2022 |
| Crime other | 0 | number per 1000 inhabitants | 2022 |
| Crime total | 18 | number per 1000 inhabitants | 2022 |
| Regional | Value | Unit | Year |
|---|---|---|---|
| Region code | BU19240605 | code | 2023 |
| Region name | Oude-Tonge industriegebied | name | 2023 |
| Region type | Buurt | type | 2023 |
| Population density | 38 | number per km2 | 2023 |
| Passenger cars per surface | 111 | average per km² | 2022 |
| Surface total | 112 | hectares | 2023 |
| Surface land | 108 | hectares | 2023 |
| Surface water | 4 | hectares | 2023 |
| Zipcode most occuring | 3255.0 | postal code | 2023 |
| Measure of urbanity | 4 | indicator 1-5 | 2023 |
| Address density | 527 | average per km2 | 2023 |
| Transport | Value | Unit | Year |
|---|---|---|---|
| Passenger cars total | 120 | number | 2022 |
| Passenger cars petrol | 75 | number | 2022 |
| Passenger cars other fuel | 50 | number | 2022 |
| Passenger cars per household | no data | average | no data |
| Motorcycles | 10 | number | 2022 |
Download all data for all years and all regional levels for The Netherlands as a whole or a specific municipality. Try this example download for free. (The downloads are currently still in Dutch, translation can be prioritised on request.)
Data is used from multiple Dutch open data providers. See this description of the sources with the definitions of all regional topics.
Sources & definitionsThis page will be further expanded with more topics in clear graphs. This will be done in several iterations in the coming weeks.
![]()
© Published:
 Contents and more information: