Population per year
The neighbourhood Schansdijk en omgeving has 52 inhabitants in 2026.
One moment please:
Your device is loading the charts from AllCharts.info
The chart above shows the number of inhabitants per year based on data from CBS for the neighbourhood Schansdijk en omgeving.
The table below shows the number of inhabitants per year based on data from CBS for the neighbourhood Schansdijk en omgeving:
| Jaar | Population Neighbourhood Schansdijk en omgeving | % difference |
|---|---|---|
| 2026 | 52 | -5,5% |
| 2025 | 55 | 0,0% |
| 2024 | 55 | 10% |
| 2023 | 50 | 0,0% |
| 2022 | 50 | -9,1% |
| 2021 | 55 | -8,3% |
| 2020 | 60 | 0,0% |
| 2019 | 60 | 9,1% |
| 2018 | 55 | 10% |
| 2017 | 50 | 0,0% |
| 2016 | 50 | 0,0% |
| 2015 | 50 | 0,0% |
| 2014 | 50 | -9,1% |
| 2013 | 55 | geen data |
Het number of inhabitants in the neighbourhood Schansdijk en omgeving has changed with 3 persons from 55 persons in 2013 to 52 persons in 2026 (that is a change of 5,5%). The average difference per year over the entire period from 2013 to 2026 was -0 persons (-0,22%).
The number of inhabitants is the number of persons as recorded in the population register on the first of January of each year.
Population at the map of the neighbourhood Schansdijk en omgeving
Map of the surroundings of the neighbourhood Schansdijk en omgeving.
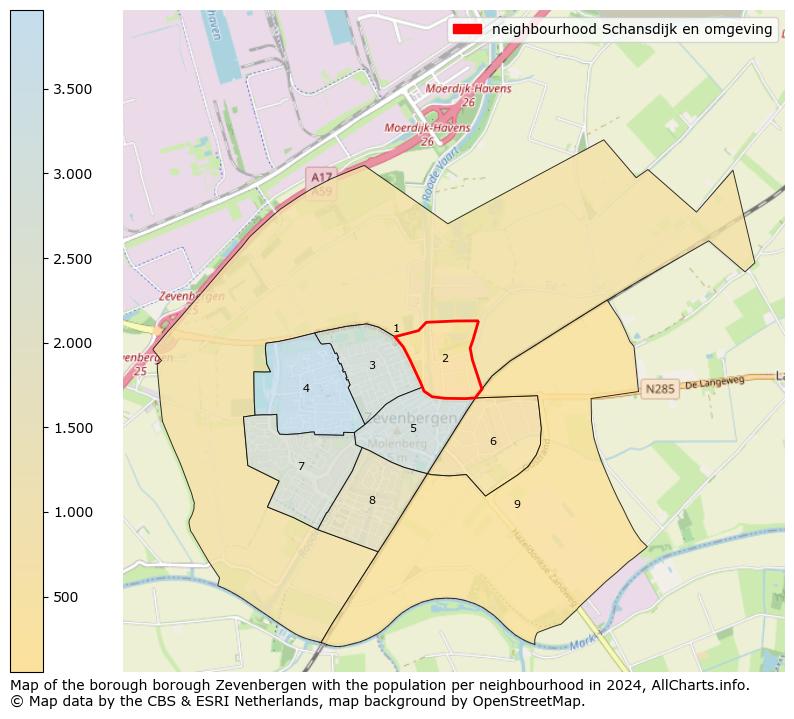
Map of the borough Zevenbergen with the population per neighbourhood in 2025. The numbers at the map represent the following neighbourhoods: 1: Verspreide huizen ten westen van Zevenbergen, 2: Schansdijk en omgeving, 3: Torenveld, 4: Krooswijk, 5: Centrum, 6: Zwanengat en omgeving, 7: Lindonk, 8: Bosselaar, 9: Verspreide huizen ten oosten van Zevenbergen.
Regional overviewAdvertisement:
House characteristics
There are 21 houses in de buurt Schansdijk en omgeving.

The four pie charts above show the percentage distribution of dwellings by various housing characteristics. Available categories include ownership, occupancy, dwelling type, building type, and construction period. The year to which the data apply is shown at the center of the chart. Click the image to view a larger version.
See the explanation below for the definitions of the housing characteristics.
Definitions of the characteristics of the dwellings in the neighbourhood Schansdijk en omgeving:
- Houses by ownership:
- Homes for sale are owned by the resident (s) or used as a second home. Rental houses are not occupied by the owner of the house. Rental homes are divided into (1) homes owned by a housing association or other institution. And (2) rental properties owned by companies, individuals and investors.
- Houses by occupation:
- A house is occupied if, according to the Personal Records Database, at least 1 person was registered at the corresponding address. All other homes are considered uninhabited.
- Houses by type:
- A house is defined as 'multi-family' when it forms a whole building together with other houses or (business) spaces. This includes flats, gallery houses, ground floor and upstairs apartments, and apartments and houses above business premises. All other homes are defined as the 'single-family' type.
- Houses by contruction period:
- The year of construction is the year in which a building containing a home was originally delivered. The construction period as used here has two possible values: (1) built in or after the year 2000 and (2) built before the year 2000.
Average house value per year in the neighbourhood Schansdijk en omgeving
The average property value in The neighbourhood Schansdijk en omgeving was €516.000 in 2025.
One moment please:
Your device is loading the charts from AllCharts.info
The chart above shows the average WOZ property value per year in the neighbourhood Schansdijk en omgeving.
The table below shows the average WOZ house value per year based on data from the CBS for the neighbourhood Schansdijk en omgeving:
| Jaar | Average property value Neighbourhood Schansdijk en omgeving | % difference |
|---|---|---|
| 2025 | €516.000 | 2,18% |
| 2024 | €505.000 | 2,23% |
| 2023 | €494.000 | 17% |
| 2022 | €423.000 | 3,93% |
| 2021 | €407.000 | 26% |
| 2020 | €322.000 | geen data |
The average property value in the neighbourhood Schansdijk en omgeving has changed with €194.000 from €322.000 in 2020 to €516.000 in 2025 (that is a change of 60%). The average difference per year over the entire period from 2020 to 2025 was €38.800 (10%). The development of the data over time follows a monotonically increasing trend: The numbers grow every year.
Determination of the real estate value (WOZ value):
- Average dwelling value based on the WOZ:
- When determining the average dwelling value, only real estate objects are included that are registered as homes (main residence or home with practice space). The (provisional) average home value is determined with the valuation date of the previous year (this is based on the WOZ, the Real Estate Valuation Act).
Types of dwellings
Apartments is most common in Neighbourhood Schansdijk en omgeving: there are 36 addresses with house type apartments.
One moment please:
Your device is loading the charts from AllCharts.info
The pie chart above shows the number and percentage of dwellings by type in the neighbourhood Schansdijk en omgeving.
The data on types of dwellings are based on the Kadaster housing classification and the Kadaster records on fixed and mobile residential units. The dwelling type is determined using a geographic-algorithmic method for buildings that contain a residential unit (buildings with a residential use function). The data reflect the situation as of 1 juli 2026.
Energy labels
The most common energy labels in Neighbourhood Schansdijk en omgeving are A (24 addresses) and G (7 addresses).
One moment please:
Your device is loading the charts from AllCharts.info
The chart above shows the number of addresses per type of energy label in the neighbourhood Schansdijk en omgeving. For this purpose, data at address level from the EP-Online system of the RVO was used. EP-Online is the official national database containing energy labels and energy performance indicators of buildings. The data used apply to the situation as per July 1st, 2026.
An energy label indicates how energy-efficient a building is. G is the worst energy label, and A+++++ is the best. Energy label A is most common in Neighbourhood Schansdijk en omgeving: 24 addresses have energy label A. The download with detailed information for the municipality Moerdijk contains the data on energy labels, both per postal code, place of residence, district, and neighbourhood, as well as per address.
Traffic accidents by outcome
There were 1 traffic accidents in total in Neighbourhood Schansdijk en omgeving in 2024.
One moment please:
Your device is loading the charts from AllCharts.info
The above graph shows the development of the number of traffic accidents in the neighbourhood Schansdijk en omgeving. Use the filter above the graph to choose the display of the number of traffic accidents by the outcome of the accident.
The table below shows the number of traffic accidents in the neighbourhood Schansdijk en omgeving in 2024.
| Outcome of traffic accidents | Number of traffic accidents in 2024 |
|---|---|
| Total | 1 |
| Material damage | 1 |
| Personal injury | 0 |
| Fatal outcome | 0 |
The traffic accident dataset BRON is linked to the digital road network. Based on the location of the accidents, it is determined which accidents fall within the neighbourhood Schansdijk en omgeving.
Figures on traffic accidents
The data on accidents come from the Registered Accidents Netherlands (BRON) database of Rijkswaterstaat. This dataset contains traffic accident reports from the police linked to the digital road network. The accidents are categorized by the outcome of the accident: solely material damage, accidents with injured victims, and accidents with fatal outcomes. Personal injury is damage that someone has suffered due to physical injuries or psychological problems. Accidents with injured victims include all situations where someone has been hospitalized due to the accident, where first aid has been administered, and all other accidents where someone has been injured.
Police data about crime
The four charts below show the recorded crimes based on data from the police and the CBS for the neighbourhood Schansdijk en omgeving. The descriptions of the types of crimes as used by the police can be found in the table with definitions of the different types of crimes (this information is in Dutch). The police data is updated monthly, the most recent update was on July 15th, 2026.
Total recorded crime per month or per year
In 2025 a total of 10 crimes were registered in Neighbourhood Schansdijk en omgeving.
One moment please:
Your device is loading the charts from AllCharts.info
Total number of registered crimes in the neighbourhood Schansdijk en omgeving, from 2012 to 2025 inclusive (when displaying the data per year) or January 2025 to June 2026 (when displaying the data per month).
In the neighbourhood Schansdijk en omgeving a total of 137 crimes have been registered from 2012 to 2025. These crimes are classified into 22 different types of crime. In 2025 the police recorded 10 crimes in the neighbourhood Schansdijk en omgeving. Use the filter above the graph to show the data per month or per year.
Crimes by type of crime
The most common types of crimes in Neighbourhood Schansdijk en omgeving in 2025 are Theft from/of motor vehicles (1 crimes) en Theft of mopeds, scooters, bicycles (1 crimes).
One moment please:
Your device is loading the charts from AllCharts.info
Number of crimes for the ten most common types of crimes, 2025, neighbourhood Schansdijk en omgeving.
Crime definitions (Dutch)Total crime per month
In June 2026 a total of 3 crimes were registered in Neighbourhood Schansdijk en omgeving.

The heatmap above provides a visual representation of the total number of crimes registered by the police per month in the neighbourhood Schansdijk en omgeving over the past 6 years.
All data is available in the Excel document with police data as part of the download for the municipality of Moerdijk.
Crimes per 1,000 inhabitants
There were 91 crimes per 1,000 inhabitants of the type ‘diefstal’ in 2025 in Neighbourhood Schansdijk en omgeving.
One moment please:
Your device is loading the charts from AllCharts.info
Crime: number of crimes per 1,000 inhabitants in 2025 in the neighbourhood Schansdijk en omgeving.
The chart shows the latest data on the number of crimes per 1,000 inhabitants for the neighbourhood Schansdijk en omgeving. For this purpose, the data on crimes have been grouped into (1) the total number of thefts (all forms, such as theft from homes and sheds, theft of cars and bicycles and shoplifting), (2) violence and sex crimes, (3) environmental violations, (4) fraud, (5) traffic violations, (6) vandalism and crimes against public order and (7) all other crimes.
Advertentie:
Births per 1,000 inhabitants
0 babies per 1,000 inhabitants were born in 2024 in Neighbourhood Schansdijk en omgeving.
One moment please:
Your device is loading the charts from AllCharts.info
The chart above shows the development of the number of live babies born per 1,000 inhabitants the neighbourhood Schansdijk en omgeving.
De cijfers over de geboortes per 1.000 aantal inwoners zijn berekend door het aantal levendgeborenen van 1 januari tot en met 31 december te delen door het aantal inwoners op 1 januari van het betreffende jaar.
Birth figures
The figures on the relative number of births are based on data from CBS. The basis for this is the number of live births from January 1 to December 31 in relation to the number of inhabitants on January 1 of a year in the neighbourhood Schansdijk en omgeving. The relative number of births may be higher than expected based on the population. The relative figure concerns the number of births during the year compared to the number of inhabitants on January 1. In new-build areas, the number of residents can grow significantly in a year. For example, 10 children can be born in 1 year in a neighbourhood in which only 10 inhabitants live on January 1, but at the end of the year, for example, 200 inhabitants.
Deaths per 1,000 inhabitants
19 people per 1,000 inhabitants died in 2024 in Neighbourhood Schansdijk en omgeving.
One moment please:
Your device is loading the charts from AllCharts.info
The graph above shows the development of the number of deaths per 1,000 inhabitants the neighbourhood Schansdijk en omgeving.
The figures on mortality per 1,000 inhabitants are based on data from CBS. The relative mortality is determined as the number of deaths from January 1 to December 31, per 1,000 inhabitants on January 1 of the year in question.
More mortality (Dutch)Data on more than 250 topics!
View the data on all topics in the table below.
| Topic | Category | Value | Unit | Year |
|---|---|---|---|---|
| Region code | Regional | BU17090005 | Code | 2025 |
| Region name | Regional | Schansdijk en omgeving | Name | 2025 |
| Region type | Regional | Buurt | Categorical type | 2025 |
| Sort code | Regional | 17090005 | Code | 2025 |
| Inhabitants | Population | 52 | Number | 2026 |
| Men | Population | 25 | Number | 2025 |
| Women | Population | 25 | Number | 2025 |
| Ages 0 - 15 | Population | 5 | Number | 2026 |
| Ages 15 - 25 | Population | 10 | Number | 2026 |
| Ages 25 - 45 | Population | 5 | Number | 2026 |
| Ages 45 - 65 | Population | 25 | Number | 2026 |
| Ages 65 and up | Population | 10 | Number | 2026 |
| Not married | Population | 25 | Number | 2025 |
| Married | Population | 25 | Number | 2025 |
| Divorced | Population | 5 | Number | 2025 |
| Widowed | Population | 0 | Number | 2025 |
| % Men | Population | 50% | Percentage | 2025 |
| % Women | Population | 50% | Percentage | 2025 |
| % Ages 0 - 15 | Population | 9.6% | Percentage | 2026 |
| % Ages 15 - 25 | Population | 19% | Percentage | 2026 |
| % Ages 25 - 45 | Population | 9.6% | Percentage | 2026 |
| % Ages 45 - 65 | Population | 48% | Percentage | 2026 |
| % Ages 65 and up | Population | 19% | Percentage | 2026 |
| % Not married | Population | 45% | Percentage | 2025 |
| % Married | Population | 45% | Percentage | 2025 |
| % Divorced | Population | 9.1% | Percentage | 2025 |
| % Widowed | Population | 0.0% | Percentage | 2025 |
| Births total | Population | 0 | Number | 2024 |
| Births relative | Population | 0 | Number per 1,000 inhabitants | 2024 |
| Mortality total | Population | 0 | Number | 2024 |
| Mortality relative | Population | 19 | Number per 1,000 inhabitants | 2024 |
| Origin Netherlands | Migration | 50 | Number | 2025 |
| Origin outside Netherlands | Migration | 5 | Number | 2025 |
| Origin Europe | Migration | 5 | Number | 2025 |
| Origin outside Europe | Migration | 0 | Number | 2025 |
| % Origin Netherlands | Migration | 91% | Percentage | 2025 |
| % Origin outside Netherlands | Migration | 9.1% | Percentage | 2025 |
| % Origin Europe | Migration | 9.1% | Percentage | 2025 |
| % Origin outside Europe | Migration | 0.0% | Percentage | 2025 |
| Born in Netherlands origin Netherlands | Migration | 50 | Number | 2025 |
| Born in Netherlands origin Europe | Migration | 5 | Number | 2025 |
| Born in Netherlands origin outside Europe | Migration | 0 | Number | 2025 |
| Born in Netherlands origin outside Netherlands | Migration | 5 | Number | 2025 |
| Born in Netherlands | Migration | 55 | Number | 2025 |
| Born outside Netherlands origin Europe | Migration | 0 | Number | 2025 |
| Born outside Netherlands origin outside Europe | Migration | 5 | Number | 2025 |
| Born outside Netherlands | Migration | 5 | Number | 2025 |
| % Born in Netherlands origin Netherlands | Migration | 91% | Percentage | 2025 |
| % Born in Netherlands origin Europe | Migration | 9.1% | Percentage | 2025 |
| % Born in Netherlands origin outside Netherlands | Migration | 9.1% | Percentage | 2025 |
| % Born in Netherlands origin outside Europe | Migration | 0.0% | Percentage | 2025 |
| % Born in Netherlands | Migration | 100% | Percentage | 2025 |
| % Born outside Netherlands origin Europe | Migration | 0.0% | Percentage | 2025 |
| % Born outside Netherlands origin outside Europe | Migration | 9.1% | Percentage | 2025 |
| % Born outside Netherlands | Migration | 9.1% | Percentage | 2025 |
| Native Dutch | Migration | 50 | Number | 2022 |
| Western total | Migration | 0 | Number | 2022 |
| Non-western total | Migration | 0 | Number | 2022 |
| Dutch Antilles and Aruba | Migration | 0 | Number | 2022 |
| Morocco | Migration | 0 | Number | 2022 |
| Suriname | Migration | 0 | Number | 2022 |
| Turkey | Migration | 0 | Number | 2022 |
| Other non-western | Migration | 0 | Number | 2022 |
| Primary school pupils | Education | 0 | Number | 2025 |
| Secondary school pupils | Education | 10 | Number | 2025 |
| Secondary vocational education students (MBO) | Education | 0 | Number | 2025 |
| Higher professional education students (HBO) | Education | 0 | Number | 2025 |
| University students (WO) | Education | 0 | Number | 2025 |
| Practical education level | Education | 20 | Number | 2022 |
| Intermediate education level | Education | 20 | Number | 2022 |
| Higher education level | Education | 10 | Number | 2022 |
| % Practical education level | Education | 40% | Percentage | 2022 |
| % Intermediate education level | Education | 40% | Percentage | 2022 |
| % Higher education level | Education | 20% | Percentage | 2022 |
| Households | Households | 20 | Number | 2025 |
| Single-person households | Households | 5 | Number | 2025 |
| Multi-person households | Households | 15 | Number | 2025 |
| Multi-person households without children | Households | 5 | Number | 2025 |
| Multi-person households with children | Households | 10 | Number | 2025 |
| % Single-person households | Households | 25% | Percentage | 2025 |
| % Multi-person households | Households | 75% | Percentage | 2025 |
| % Multi-person households without children | Households | 25% | Percentage | 2025 |
| % Multi-person households with children | Households | 50% | Percentage | 2025 |
| Average household size | Households | 2.5 | Average number | 2025 |
| Employed labour force | Income | 40 | Number | 2024 |
| Net labor participation | Income | no data | Percentage | no data |
| % Employees | Income | no data | Percentage | no data |
| % Employees with permanent contracts | Income | no data | Percentage | no data |
| % Employees with flexible contracts | Income | no data | Percentage | no data |
| % Self-employed | Income | no data | Percentage | no data |
| Income receivers per 1,000 inhabitants | Income | 0 | Number | 2024 |
| Income receivers | Income | 0 | Number per 1,000 inhabitants | 2024 |
| Average income per income recipient | Income | no data | Average in euro | no data |
| Average income per inhabitant | Income | no data | Average in euro | no data |
| 40% persons with lowest income | Income | no data | Percentage | no data |
| 20% persons with highest income | Income | no data | Percentage | no data |
| % persons | Income | no data | Percentage | no data |
| % persons | Income | no data | Percentage | no data |
| Average standardized household income | Income | no data | euro | no data |
| 40% households with lowest income | Income | no data | Percentage | no data |
| 20% households with highest income | Income | no data | Percentage | no data |
| Households with a low income | Income | no data | Percentage | no data |
| % Households at social minimum | Income | no data | Percentage | no data |
| Households up to 110% of the social minimum | Income | no data | Percentage | no data |
| Households up to 120% of the social minimum | Income | no data | Percentage | no data |
| Median capital assets of private households | Income | no data | euro | no data |
| Persons with social security welfare | Income | 0 | Number | 2025 |
| Persons with social security for incapacity for work | Income | 0 | Number | 2025 |
| Persons with social security for unemployed | Income | 0 | Number | 2025 |
| Persons with social security for elderly | Income | 10 | Number | 2025 |
| Persons with social security welfare | Income | 0% | Percentage | 2025 |
| Persons with social security for incapacity for work | Income | 0% | Percentage | 2025 |
| Persons with social security for unemployed | Income | 0% | Percentage | 2025 |
| Persons with social security for elderly | Income | 18% | Percentage | 2025 |
| Young people with youth care in kind | Population | no data | Number | no data |
| % Young people with youth care | Population | no data | Percentage | no data |
| Wmo clients | Population | no data | Number | no data |
| Wmo clients relative | Population | no data | Number per 1,000 inhabitants | no data |
| Housing stock | Houses | 21 | Number | 2025 |
| Houses per 1,000 inhabitants | Houses | 382 | Number per 1,000 inhabitants | 2025 |
| Newly built dwellings | Houses | 0 | Number | 2025 |
| Non-dwelling stock | Houses | 147 | Number | 2025 |
| Newly built non-dwellings | Houses | 11 | Number | 2025 |
| Average house value | Houses | €516,000 | Average in euro | 2025 |
| House value class | Houses | €500.000 tot €750.000 | Categorical type | 2025 |
| Single-family houses | Houses | 20 | Number | 2025 |
| Multi-family houses | Houses | 1 | Number | 2025 |
| Privately owned homes | Houses | 20 | Number | 2025 |
| Rented homes | Houses | 1 | Number | 2025 |
| Rental-housing by corporation | Houses | 0 | Number | 2025 |
| Homes other rental | Houses | 1 | Number | 2025 |
| Ownership unknown | Houses | 0 | Number | 2025 |
| Inhabited | Houses | 20 | Number | 2025 |
| Uninhabited | Houses | 1 | Number | 2025 |
| % Privately owned homes | Houses | 95% | Percentage | 2025 |
| % Rented homes | Houses | 5% | Percentage | 2025 |
| % Rental-housing by corporation | Houses | 0% | Percentage | 2025 |
| % Homes other rental | Houses | 5% | Percentage | 2025 |
| % Ownership unknown | Houses | 0% | Percentage | 2025 |
| % Single-family houses | Houses | 95% | Percentage | 2025 |
| % Multi-family houses | Houses | 5% | Percentage | 2025 |
| % Inhabited | Houses | 95% | Percentage | 2025 |
| % Uninhabited | Houses | 5% | Percentage | 2025 |
| Apartments | Houses | 36 | Number | 2026 |
| Terraced houses | Houses | 1 | Number | 2026 |
| Corner dwelling type | Houses | 1 | Number | 2026 |
| Semi-detached houses | Houses | 4 | Number | 2026 |
| Detached houses | Houses | 14 | Number | 2026 |
| Unknown dwelling type | Houses | 0 | Number | 2026 |
| % Apartment dwelling type | Houses | 64% | Percentage | 2026 |
| % Terraced or linked dwelling type | Houses | 2.0% | Percentage | 2026 |
| % Corner dwelling type | Houses | 2.0% | Percentage | 2026 |
| % Semi-detached dwelling type | Houses | 7% | Percentage | 2026 |
| % Detached dwelling type | Houses | 25% | Percentage | 2026 |
| % Unknown dwelling type | Houses | 0.0% | Percentage | 2026 |
| Dwellings built before 1945 | Houses | 14 | Number | 2026 |
| Dwellings built from 1945 to 1965 | Houses | 3 | Number | 2026 |
| Dwellings built from 1965 to 1975 | Houses | 0 | Number | 2026 |
| Dwellings built from 1975 to 1985 | Houses | 0 | Number | 2026 |
| Dwellings built from 1985 to 1995 | Houses | 0 | Number | 2026 |
| Dwellings built from 1995 to 2005 | Houses | 1 | Number | 2026 |
| Dwellings built from 2005 to 2015 | Houses | 0 | Number | 2026 |
| Dwellings built from 2015 to 2025 | Houses | 1 | Number | 2026 |
| Dwellings built from 2025 onwards | Houses | 36 | Number | 2026 |
| Dwellings unknown year of built | Houses | 1 | Number | 2026 |
| % Dwellings built before 1945 | Houses | 25% | Percentage | 2026 |
| % Dwellings built from 1945 to 1965 | Houses | 5% | Percentage | 2026 |
| % Dwellings built from 1965 to 1975 | Houses | 0.0% | Percentage | 2026 |
| % Dwellings built from 1975 to 1985 | Houses | 0.0% | Percentage | 2026 |
| % Dwellings built from 1985 to 1995 | Houses | 0.0% | Percentage | 2026 |
| % Dwellings built from 1995 to 2005 | Houses | 2.0% | Percentage | 2026 |
| % Dwellings built from 2005 to 2015 | Houses | 0.0% | Percentage | 2026 |
| % Dwellings built from 2015 to 2025 | Houses | 2.0% | Percentage | 2026 |
| % Dwellings built from 2025 onwards | Houses | 64% | Percentage | 2026 |
| % Dwellings unknown year of built | Houses | 2.0% | Percentage | 2026 |
| Average electricity supply per home | Energy | 4,370 | Average in kWh | 2024 |
| Average electricity feed-in | Energy | 1,920 | Average in kWh | 2024 |
| % Homes with solar power | Energy | no data | Percentage | no data |
| % Homes primarily heated by electricity | Energy | no data | Percentage | no data |
| Average electricity usage apartment | Energy | no data | Average in kWh | no data |
| Average electricity usage terraced homes | Energy | no data | Average in kWh | no data |
| Average electricity usage corner homes | Energy | no data | Average in kWh | no data |
| Average electricity usage semi-detached homes | Energy | 2,870 | Average in kWh | 2023 |
| Average electricity usage detached homes | Energy | 4,550 | Average in kWh | 2023 |
| Average electricity usage owner-occupied homes | Energy | no data | Average in kWh | no data |
| Average electricity usage rental homes | Energy | 4,140 | Average in kWh | 2023 |
| Average natural gas usage total | Energy | 1,050 | Average per m³ | 2024 |
| % Homes with district heating | Energy | 0% | Percentage | 2014 |
| % Natural gas-free homes | Energy | no data | Percentage | no data |
| % Natural gas homes | Energy | no data | Percentage | no data |
| Average natural gas usage apartment | Energy | no data | Average per m³ | no data |
| Average natural gas usage terraced homes | Energy | no data | Average per m³ | no data |
| Average natural gas usage corner homes | Energy | no data | Average per m³ | no data |
| Average natural gas usage semi-detached homes | Energy | 1,040 | Average per m³ | 2023 |
| Average natural gas usage detached homes | Energy | 1,250 | Average per m³ | 2023 |
| Average natural gas usage owner-occupied homes | Energy | 1,220 | Average per m³ | 2023 |
| Average natural gas usage rental homes | Energy | no data | Average per m³ | no data |
| Businesses total | Business | 125 | Number | 2025 |
| Businesses agriculture, forestry, fishing | Business | 0 | Number | 2025 |
| Businesses industry and energy | Business | 30 | Number | 2025 |
| Businesses trade and catering | Business | 45 | Number | 2025 |
| Businesses transport, information, communication | Business | 10 | Number | 2025 |
| Businesses financial services, real estate | Business | 10 | Number | 2025 |
| Businesses business services | Business | 20 | Number | 2025 |
| Government, education, care | Business | 10 | Number | 2025 |
| Businesses culture, recreation, other services | Business | 0 | Number | 2025 |
| % Businesses agriculture, forestry, fishing | Business | 0.0% | Percentage | 2025 |
| % Businesses industry and energy | Business | 24% | Percentage | 2025 |
| % Businesses trade and catering | Business | 36% | Percentage | 2025 |
| % Businesses transport, information, communication | Business | 8% | Percentage | 2025 |
| % Businesses financial services, real estate | Business | 8% | Percentage | 2025 |
| % Businesses business services | Business | 16% | Percentage | 2025 |
| % Government, education, care | Business | 8% | Percentage | 2025 |
| % Businesses culture, recreation, other services | Business | 0.0% | Percentage | 2025 |
| Passenger cars total | Transport | 135 | Number | 2025 |
| Passenger cars petrol | Transport | 70 | Number | 2025 |
| Passenger cars other fuel | Transport | 65 | Number | 2025 |
| Passenger cars per household | Transport | 6.8 | Number | 2025 |
| Passenger cars per surface | Transport | 287 | Number | 2025 |
| Motorcycles | Transport | 15 | Number | 2025 |
| Public charging stations | Transport | no data | Number | no data |
| Surface total | Regional | 49 | Number of hectares | 2025 |
| Surface land | Regional | 47 | Number of hectares | 2025 |
| Surface water | Regional | 2 | Number of hectares | 2025 |
| Population density | Regional | 117 | Number per km² | 2025 |
| Degree of urbanization | Regional | 4 | Indicator 1-5 | 2025 |
| Address density | Regional | 987 | Average number per km² | 2025 |
| Crime total | Crime | 10 | Number | 2025 |
| Crime theft | Crime | 5 | Number | 2025 |
| Crime violence and sexual abuse | Crime | 1 | Number | 2025 |
| Crime environmental | Crime | 0 | Number | 2025 |
| Crime scam | Crime | 0 | Number | 2025 |
| Crime traffic | Crime | 1 | Number | 2025 |
| Crime destruction | Crime | 1 | Number | 2025 |
| Crime other | Crime | 2 | Number | 2025 |
| Crime | Crime | 182 | Number per 1,000 inhabitants | 2025 |
| Crime theft | Crime | 91 | Number per 1,000 inhabitants | 2025 |
| Crime violence and sexual abuse | Crime | 18 | Number per 1,000 inhabitants | 2025 |
| Crime environmental | Crime | 0 | Number per 1,000 inhabitants | 2025 |
| Crime scam | Crime | 0 | Number per 1,000 inhabitants | 2025 |
| Crime traffic | Crime | 18 | Number per 1,000 inhabitants | 2025 |
| Crime destruction | Crime | 18 | Number per 1,000 inhabitants | 2025 |
| Crime other | Crime | 36 | Number per 1,000 inhabitants | 2025 |
| Traffic accidents total | Traffic accidents | 1 | Number | 2024 |
| Traffic accidents only material damage | Traffic accidents | 1 | Number | 2024 |
| Traffic accidents injuries | Traffic accidents | 0 | Number | 2024 |
| Traffic accidents deadly | Traffic accidents | 0 | Number | 2024 |
| Addresses total | Regional | 220 | Number | 2026 |
| Addresses with postal code | Regional | 220 | Number | 2026 |
| Addresses with residential function | Regional | 56 | Number | 2026 |
| Addresses with meeting function | Regional | 1 | Number | 2026 |
| Addresses with cell function | Regional | 0 | Number | 2026 |
| Addresses with healthcare function | Regional | 1 | Number | 2026 |
| Addresses with industrial function | Regional | 133 | Number | 2026 |
| Addresses with office function | Regional | 13 | Number | 2026 |
| Addresses with lodging function | Regional | 1 | Number | 2026 |
| Addresses with educational function | Regional | 0 | Number | 2026 |
| Addresses with sports function | Regional | 1 | Number | 2026 |
| Addresses with retail function | Regional | 3 | Number | 2026 |
| Addresses with other usage function | Regional | 24 | Number | 2026 |
| Residential objects | Regional | 220 | Number | 2026 |
| Berth locations | Regional | 0 | Number | 2026 |
| Stand locations | Regional | 0 | Number | 2026 |
| Buildings with address | Regional | 82 | Number | 2026 |
| Addresses with building | Regional | 219 | Number | 2026 |
| Parcels with address | Regional | 143 | Number | 2026 |
| Addresses with parcel | Regional | 220 | Number | 2026 |
| Addresses within built-up area | Regional | 0 | Number | 2026 |
| Addresses outside built-up area | Regional | 220 | Number | 2026 |
| Addresses with residential function within built-up area | Regional | 0 | Number | 2026 |
| Addresses with residential function outside built-up area | Regional | 56 | Number | 2026 |
| Buildings before 1700 | Regional | 0 | Number | 2026 |
| Buildings 1700 to 1900 | Regional | 7 | Number | 2026 |
| Buildings 1900 to 1925 | Regional | 3 | Number | 2026 |
| Buildings 1925 to 1950 | Regional | 8 | Number | 2026 |
| Buildings 1950 to 1970 | Regional | 11 | Number | 2026 |
| Buildings 1970 to 1980 | Regional | 1 | Number | 2026 |
| Buildings 1980 to 1990 | Regional | 2 | Number | 2026 |
| Buildings 1990 to 2000 | Regional | 15 | Number | 2026 |
| Buildings 2000 to 2010 | Regional | 25 | Number | 2026 |
| Buildings 2010 to 2020 | Regional | 3 | Number | 2026 |
| Buildings 2020 and later | Regional | 7 | Number | 2026 |
| Buildings built before 1700 | Regional | 0 | Number | 2026 |
| Buildings built from 1700 to 1900 | Regional | 7 | Number | 2026 |
| Buildings built from 1900 to 1925 | Regional | 6 | Number | 2026 |
| Buildings built from 1925 to 1950 | Regional | 11 | Number | 2026 |
| Buildings built from 1950 to 1970 | Regional | 11 | Number | 2026 |
| Buildings built from 1970 to 1980 | Regional | 1 | Number | 2026 |
| Buildings built from 1980 to 1990 | Regional | 3 | Number | 2026 |
| Buildings built from 1990 to 2000 | Regional | 18 | Number | 2026 |
| Buildings built from 2000 to 2010 | Regional | 100 | Number | 2026 |
| Buildings built from 2010 to 2020 | Regional | 3 | Number | 2026 |
| Buildings built from 2020 onwards | Regional | 59 | Number | 2026 |
| Undetermined energy label | Energy consumption | 161 | Number | 2026 |
| Provisional energy label | Energy consumption | 20 | Number | 2026 |
| Final energy labels | Energy consumption | 39 | Number | 2026 |
| Energy label A+++++ | Energy consumption | 1 | Number | 2026 |
| Energy label A++++ | Energy consumption | 1 | Number | 2026 |
| Energy label A+++ | Energy consumption | 1 | Number | 2026 |
| Energy label A++ | Energy consumption | 3 | Number | 2026 |
| Energy label A+ | Energy consumption | 5 | Number | 2026 |
| Energy label A | Energy consumption | 24 | Number | 2026 |
| Energy label B | Energy consumption | 3 | Number | 2026 |
| Energy label C | Energy consumption | 4 | Number | 2026 |
| Energy label D | Energy consumption | 4 | Number | 2026 |
| Energy label E | Energy consumption | 3 | Number | 2026 |
| Energy label F | Energy consumption | 3 | Number | 2026 |
| Energy label G | Energy consumption | 7 | Number | 2026 |
| Zipcode area | Regional | 4761PJ-4761RM | Name | 2026 |
| Most common zipcode | Regional | 4761 | Name | 2026 |
| Coverage percentage most common zipcode | Regional | 100% | Percentage | 2026 |
| Distance to general practitioner | Proximity | 0.8 | Average distance in km | 2025 |
| General practitioners within 1 km | Proximity | 1.5 | Average number | 2025 |
| General practitioners within 3 km | Proximity | 3.0 | Average number | 2025 |
| General practitioners within 5 km | Proximity | 3.0 | Average number | 2025 |
| Distance to general practitioner post | Proximity | 18 | Average distance in km | 2024 |
| Pharmacy distance | Proximity | 1.1 | Average distance in km | 2025 |
| Hospital with outpatient clinic distance | Proximity | 11 | Average distance in km | 2025 |
| Hospitals with outpatient clinic within 5 km | Proximity | 0.0 | Average number | 2025 |
| Hospitals with outpatient clinic within 10 km | Proximity | 0.0 | Average number | 2025 |
| Hospitals with outpatient clinic within 20 km | Proximity | 6.7 | Average number | 2025 |
| Hospital distance | Proximity | 18 | Average distance in km | 2025 |
| Hospitals within 5 km | Proximity | 0.0 | Average number | 2025 |
| Hospitals within 10 km | Proximity | 0.0 | Average number | 2025 |
| Hospitals within 20 km | Proximity | 1.5 | Average number | 2025 |
| Large supermarket distance | Proximity | 0.9 | Average distance in km | 2025 |
| Large supermarkets within 1 km | Proximity | 0.9 | Average number | 2025 |
| Large supermarkets within 3 km | Proximity | 5 | Average number | 2025 |
| Large supermarkets within 5 km | Proximity | 5 | Average number | 2025 |
| Other daily groceries distance | Proximity | 1.1 | Average distance in km | 2025 |
| Other daily groceries within 1 km | Proximity | 1.4 | Average number | 2025 |
| Other daily groceries within 3 km | Proximity | 15 | Average number | 2025 |
| Other daily groceries within 5 km | Proximity | 15 | Average number | 2025 |
| Department store distance | Proximity | 1.3 | Average distance in km | 2025 |
| Department stores within 5 km | Proximity | 1.0 | Average number | 2025 |
| Department stores within 10 km | Proximity | 1.0 | Average number | 2025 |
| Department stores within 20 km | Proximity | 11 | Average number | 2025 |
| Cafe distance | Proximity | 0.9 | Average distance in km | 2025 |
| Cafes within 1 km | Proximity | 3.0 | Average number | 2025 |
| Cafes within 3 km | Proximity | 8 | Average number | 2025 |
| Cafes within 5 km | Proximity | 8 | Average number | 2025 |
| Snack bar distance | Proximity | 0.9 | Average distance in km | 2025 |
| Snack bars within 1 km | Proximity | 1.9 | Average number | 2025 |
| Snack bars within 3 km | Proximity | 11 | Average number | 2025 |
| Snack bars within 5 km | Proximity | 12 | Average number | 2025 |
| Restaurant distance | Proximity | 0.9 | Average distance in km | 2025 |
| Restaurants within 1 km | Proximity | 4.4 | Average number | 2025 |
| Restaurants within 3 km | Proximity | 14 | Average number | 2025 |
| Restaurants within 5 km | Proximity | 15 | Average number | 2025 |
| Hotel distance | Proximity | 0.7 | Average distance in km | 2025 |
| Hotels within 5 km | Proximity | 3.0 | Average number | 2025 |
| Hotels within 10 km | Proximity | 7 | Average number | 2025 |
| Hotels within 20 km | Proximity | 42 | Average number | 2025 |
| Daycare distance | Proximity | 1.5 | Average distance in km | 2025 |
| Daycares within 1 km | Proximity | 0.1 | Average number | 2025 |
| Daycares within 3 km | Proximity | 6 | Average number | 2025 |
| Daycares within 5 km | Proximity | 6 | Average number | 2025 |
| After-school care distance | Proximity | 1.4 | Average distance in km | 2025 |
| After-school care within 1 km | Proximity | 0.1 | Average number | 2025 |
| After-school care within 3 km | Proximity | 6 | Average number | 2025 |
| After-school care within 5 km | Proximity | 6 | Average number | 2025 |
| Primary education distance | Proximity | 1.5 | Average distance in km | 2025 |
| Primary education within 1 km | Proximity | 0.1 | Average number | 2025 |
| Primary education within 3 km | Proximity | 5 | Average number | 2025 |
| Primary education within 5 km | Proximity | 5 | Average number | 2025 |
| Secondary education total distance | Proximity | 1.7 | Average distance in km | 2024 |
| Secondary education total within 3 km | Proximity | 1.0 | Average number | 2024 |
| Secondary education total within 5 km | Proximity | 1.0 | Average number | 2024 |
| Secondary education total within 10 km | Proximity | 1.0 | Average number | 2024 |
| Secondary education VMBO distance | Proximity | 1.7 | Average distance in km | 2024 |
| Secondary education VMBO within 3 km | Proximity | 1.0 | Average number | 2024 |
| Secondary education VMBO within 5 km | Proximity | 1.0 | Average number | 2024 |
| Secondary education VMBO within 10 km | Proximity | 1.0 | Average number | 2024 |
| Secondary education HAVO VWO distance | Proximity | 1.7 | Average distance in km | 2024 |
| Secondary education HAVO VWO within 3 km | Proximity | 1.0 | Average number | 2024 |
| Secondary education HAVO VWO within 5 km | Proximity | 1.0 | Average number | 2024 |
| Secondary education HAVO VWO within 10 km | Proximity | 1.0 | Average number | 2024 |
| Public green space total distance | Proximity | 0.4 | Average distance in km | 2017 |
| Park or garden distance | Proximity | 1.4 | Average distance in km | 2017 |
| Day recreational area distance | Proximity | 2.3 | Average distance in km | 2017 |
| Forest distance | Proximity | 0.8 | Average distance in km | 2017 |
| Open natural area total distance | Proximity | 0.9 | Average distance in km | 2017 |
| Open dry natural area distance | Proximity | 6.4 | Average distance in km | 2017 |
| Open wet natural area distance | Proximity | 0.9 | Average distance in km | 2017 |
| Semi-public green space total distance | Proximity | 0.8 | Average distance in km | 2017 |
| Sports field distance | Proximity | 0.9 | Average distance in km | 2017 |
| Allotment garden distance | Proximity | 0.9 | Average distance in km | 2017 |
| Residential recreational area distance | Proximity | 4.0 | Average distance in km | 2017 |
| Cemetery distance | Proximity | 1.3 | Average distance in km | 2017 |
| Recreational inland water distance | Proximity | 8.3 | Average distance in km | 2017 |
| Main road access distance | Proximity | 0.5 | Average distance in km | 2025 |
| Train station distance | Proximity | 1.3 | Average distance in km | 2025 |
| Major transfer station distance | Proximity | 16 | Average distance in km | 2025 |
| Library distance | Proximity | 1.2 | Average distance in km | 2025 |
| Swimming pool distance | Proximity | 1.9 | Average distance in km | 2025 |
| Artificial ice rink distance | Proximity | 16 | Average distance in km | 2025 |
| Performing arts distance | Proximity | 12 | Average distance in km | 2024 |
| Performing arts within 5 km | Proximity | 0.0 | Average number | 2024 |
| Performing arts within 10 km | Proximity | 0.0 | Average number | 2024 |
| Performing arts within 20 km | Proximity | 3.0 | Average number | 2024 |
| Pop venue distance | Proximity | 17 | Average distance in km | 2024 |
| Cinema distance | Proximity | 12 | Average distance in km | 2025 |
| Cinemas within 5 km | Proximity | 0.0 | Average number | 2025 |
| Cinemas within 10 km | Proximity | 0.0 | Average number | 2025 |
| Cinemas within 20 km | Proximity | 4.0 | Average number | 2025 |
| Sauna distance | Proximity | 15 | Average distance in km | 2025 |
| Tanning salon distance | Proximity | 11 | Average distance in km | 2025 |
| Museum distance | Proximity | 7.4 | Average distance in km | 2024 |
| Museums within 5 km | Proximity | 0.0 | Average number | 2024 |
| Museums within 10 km | Proximity | 1.0 | Average number | 2024 |
| Museums within 20 km | Proximity | 6.8 | Average number | 2024 |
| Attraction distance | Proximity | 13 | Average distance in km | 2025 |
| Attractions within 10 km | Proximity | 0.0 | Average number | 2025 |
| Attractions within 20 km | Proximity | 5.5 | Average number | 2025 |
| Attractions within 50 km | Proximity | 38 | Average number | 2025 |
| Fire station distance | Proximity | 1.6 | Average distance in km | 2025 |
Table with more than 250 topics for the neighbourhood Schansdijk en omgeving.
👆 The table above shows the latest available data for the neighbourhood Schansdijk en omgeving for over 250 topics. The most recent update of the data was done at June 25th, 2026. The rows are sorted by category and subject.
Table usage:
- Search the table using the search field above the table. This will filter the rows of the table so that only rows containing the search term are displayed.
- Sort the contents of the table by clicking on the column headers.
- Navigate through the table using the buttons at the bottom right of the table.
- On small screens: Scroll the table horizontally to see all columns (the first column remains fixed in view).
Download and data sources
Download as Excel datasets and open data sources used
Download all data for all years and all regional levels for The Netherlands as a whole or a specific municipality. Try this example download for free. (The downloads are currently still in Dutch, translation can be prioritised on request.)
Data is used from multiple Dutch open data providers. See this description of the sources with the definitions of all regional topics.
Sources & definitions