Statistics neighbourhood Westerkwartier

Statistics neighbourhood Westerkwartier

Check out data on over 250 topics about the neighbourhood Westerkwartier in municipality Culemborg. Explore figures, tables, and charts, complete with clear definitions for each topic. Dive into the data now!

View many more figures and charts for the neighbourhood Westerkwartier on the Dutch version of this page at AlleCijfers.nl.

Population per year
The neighbourhood Westerkwartier has 1.195 inhabitants in 2024.


One moment please: your device is loading the charts from AllCharts.info.


The chart above shows the number of inhabitants per year based on data from CBS for the neighbourhood Westerkwartier.


The table below shows the number of inhabitants per year based on data from CBS for the neighbourhood Westerkwartier:

JaarPopulation Neighbourhood Westerkwartier% difference
20241.1950,0%
20231.195-1,24%
20221.2101,68%
20211.190-0,25%
20201.1933,92%
20191.148-2,05%
20181.1720,51%
20171.166-0,51%
20161.1720,26%
20151.169-1,52%
20141.1875,3%
20131.127geen data

Het number of inhabitants in the neighbourhood Westerkwartier has changed with 68 inhabitants from 1.127 inhabitants in 2013 to 1.195 inhabitants in 2024 (that is a change of 6%). The average difference per year over the entire period from 2013 to 2024 was 6 inhabitants (0,56%).

The number of inhabitants is the number of persons as recorded in the population register on the first of January of each year.

Population at the map of the neighbourhood Westerkwartier
Map of the surroundings of the neighbourhood Westerkwartier.
Image of the neighbourhood Westerkwartier at the map. This image is used as introduction to this page. This page shows a lot of information about the population in the neighbourhood Westerkwartier (such as the distribution by age groups of the residents, the composition of households, whether inhabitants are natives or Dutch with an immigration background, data about the houses (numbers, types, price development, use, type of property, ...) and more (car ownership, energy consumption, ...) based on open data from the Dutch Central Bureau of Statistics and various other sources!

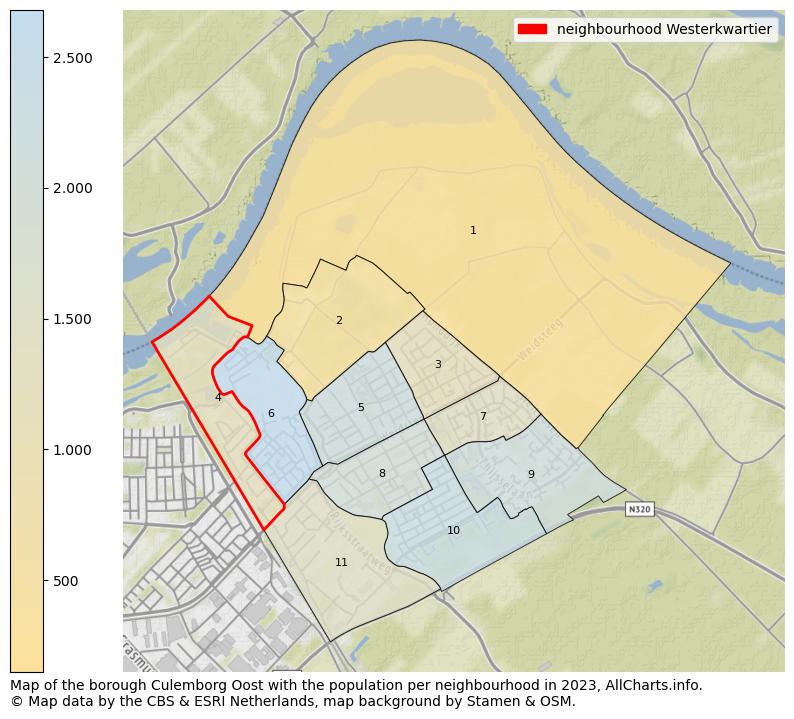
Map of the borough Culemborg Oost with the population per neighbourhood in 2024. The numbers at the map represent the following neighbourhoods: 1: Buitengebied Redichem, 2: Dreven, 3: De Hond, 4: Westerkwartier, 5: Bloemen/Oranjebuurt, 6: Binnenstad, 7: Voorkoop Noord, 8: Ter Weijde Componistenbuurt, 9: Voorkoop Zuid, 10: Ter Weijde Statenliedenbuurt, 11: Lanxmeer

Explore the statistics for all 24 regions within the municipality Culemborg using the overview page for Culemborg.

Regional overview

Advertisement:

House characteristics
There are 549 houses in de buurt Westerkwartier.
Information about the homes in this region based on open data from the Dutch Central Bureau of Statistics. Overview image with 4 pie charts.

Percentages of home ownership, occupation, type and construction period.

View the explanation for the definitions of the home characteristics.

Definitions of the characteristics of the dwellings in the neighbourhood Westerkwartier:

Houses by ownership:
Homes for sale are owned by the resident (s) or used as a second home. Rental houses are not occupied by the owner of the house. Rental homes are divided into (1) homes owned by a housing association or other institution. And (2) rental properties owned by companies, individuals and investors.
Houses by occupation:
A house is occupied if, according to the Personal Records Database, at least 1 person was registered at the corresponding address. All other homes are considered uninhabited.
Houses by type:
A house is defined as "multi-family" when it forms a whole building together with other houses or (business) spaces. This includes flats, gallery houses, ground floor and upstairs apartments, and apartments and houses above business premises. All other homes are defined as the "single-family" type.
Houses by contruction period:
The year of construction is the year in which a building containing a home was originally delivered. The construction period as used here has two possible values: (1) built in or after the year 2000 and (2) built before the year 2000.
Average house value per year in the neighbourhood Westerkwartier
The average property value in The neighbourhood Westerkwartier was €368.000 in 2024.


One moment please: your device is loading the charts from AllCharts.info.


The chart above shows the average WOZ property value per year in the neighbourhood Westerkwartier.


The table below shows the average WOZ house value per year based on data from the CBS for the neighbourhood Westerkwartier:

JaarAverage property value Neighbourhood Westerkwartier% difference
2024€368.0004,25%
2023€353.00017%
2022€303.00014%
2021€265.00013%
2020€234.0005,9%
2019€221.0005,7%
2018€209.0001,95%
2017€205.0000,49%
2016€204.0001,49%
2015€201.000-1,47%
2014€204.000-7,3%
2013€220.000geen data

The average property value in the neighbourhood Westerkwartier has changed with €148.000 from €220.000 in 2013 to €368.000 in 2024 (that is a change of 67%). The average difference per year over the entire period from 2013 to 2024 was €13.455 (5%). The development of the data over time follows a clearly increasing trend: The numbers grow almost every year.

Determination of the real estate value (WOZ value):

Average dwelling value based on the WOZ:
When determining the average dwelling value, only real estate objects are included that are registered as homes (main residence or home with practice space). The (provisional) average home value is determined with the valuation date of the previous year (this is based on the WOZ, the Real Estate Valuation Act).
Energy labels
The most common energy labels in Neighbourhood Westerkwartier are A (237 addresses) and F (97 addresses).


One moment please: your device is loading the charts from AllCharts.info.


The chart above shows the number of addresses per type of energy label in the neighbourhood Westerkwartier. For this purpose, data at address level from the EP-Online system of the RVO was used. EP-Online is the official national database containing energy labels and energy performance indicators of buildings. The data used apply to the situation as per January 1st, 2025.

An energy label indicates how energy-efficient a building is. G is the worst energy label, and A+++++ is the best. Energy label A is most common in Neighbourhood Westerkwartier: 237 addresses have energy label A. The download with detailed information for the municipality Culemborg contains the data on energy labels, both per postal code, place of residence, district, and neighbourhood, as well as per address.

Traffic accidents by outcome
There were 4 traffic accidents in total in Neighbourhood Westerkwartier in 2023.


Heel even geduld alsjeblieft: je apparaat laadt de grafieken van Allecijfers.nl.


The above graph shows the development of the number of traffic accidents in the neighbourhood Westerkwartier. Use the filter above the graph to choose the display of the number of traffic accidents by the outcome of the accident.

The traffic accident dataset BRON is linked to the digital road network. Based on the location of the accidents, it is determined which accidents fall within the neighbourhood Westerkwartier.

Figures on traffic accidents

The data on accidents come from the Registered Accidents Netherlands (BRON) database of Rijkswaterstaat. This dataset contains traffic accident reports from the police linked to the digital road network. The accidents are categorized by the outcome of the accident: solely material damage, accidents with injured victims, and accidents with fatal outcomes. Personal injury is damage that someone has suffered due to physical injuries or psychological problems. Accidents with injured victims include all situations where someone has been hospitalized due to the accident, where first aid has been administered, and all other accidents where someone has been injured.

Police data about crime

The four charts below show the recorded crimes based on data from the police and the CBS for the neighbourhood Westerkwartier. The descriptions of the types of crimes as used by the police can be found in the table with definitions of the different types of crimes (this information is in Dutch). The police data is updated monthly, the most recent update was on May 15th, 2025.

Total recorded crime per month or per year
In 2024 a total of 47 crimes were registered in Neighbourhood Westerkwartier.


Heel even geduld alsjeblieft: je apparaat laadt de grafieken van Allecijfers.nl.


Total number of registered crimes in the neighbourhood Westerkwartier, from 2012 to 2024 inclusive (when displaying the data per year) or November 2023 to April 2025 (when displaying the data per month).

In the neighbourhood Westerkwartier a total of 1,301 crimes have been registered from 2012 to 2024. These crimes are classified into 34 different types of crime. In 2024 the police recorded 47 crimes in the neighbourhood Westerkwartier. Use the filter above the graph to show the data per month or per year.

Crimes by type of crime
The most common types of crimes in Neighbourhood Westerkwartier in 2024 are Horizontal fraud (9 crimes) en Theft of mopeds, scooters, bicycles (8 crimes).


Heel even geduld alsjeblieft: je apparaat laadt de grafieken van Allecijfers.nl.


Number of crimes for the ten most common types of crimes, 2024, neighbourhood Westerkwartier.

Crime definitions (Dutch)
Total crime per month
In April 2025 a total of 5 crimes were registered in Neighbourhood Westerkwartier.
Image of a heatmap (a visual representation of data using colors to represent values) showing the total number of crimes in the neighbourhood Westerkwartier per month and per year.

The heatmap above provides a visual representation of the total number of crimes registered by the police per month in the neighbourhood Westerkwartier over the past 6 years.

All data is available in the Excel document with police data as part of the download for the municipality of Culemborg.

Crimes per 1,000 inhabitants
There were 15 crimes per 1,000 inhabitants of the type ‘diefstal’ in 2024 in Neighbourhood Westerkwartier.


Heel even geduld alsjeblieft: je apparaat laadt de grafieken van Allecijfers.nl.


Crime: number of crimes per 1,000 inhabitants in 2024 in the neighbourhood Westerkwartier.

The chart shows the latest data on the number of crimes per 1,000 inhabitants for the neighbourhood Westerkwartier. For this purpose, the data on crimes have been grouped into (1) the total number of thefts (all forms, such as theft from homes and sheds, theft of cars and bicycles and shoplifting), (2) violence and sex crimes, (3) environmental violations, (4) fraud, (5) traffic violations, (6) vandalism and crimes against public order and (7) all other crimes.

Advertentie:

Births per 1,000 inhabitants
9 babies per 1,000 inhabitants were born in 2023 in Neighbourhood Westerkwartier.


One moment please: your device is loading the charts from AllCharts.info.


The chart above shows the development of the number of live babies born per 1,000 inhabitants the neighbourhood Westerkwartier.

De cijfers over de geboortes per 1.000 aantal inwoners zijn berekend door het aantal levendgeborenen van 1 januari tot en met 31 december te delen door het aantal inwoners op 1 januari van het betreffende jaar.

Birth figures

The figures on the relative number of births are based on data from CBS. The basis for this is the number of live births from January 1 to December 31 in relation to the number of inhabitants on January 1 of a year in the neighbourhood Westerkwartier. The relative number of births may be higher than expected based on the population. The relative figure concerns the number of births during the year compared to the number of inhabitants on January 1. In new-build areas, the number of residents can grow significantly in a year. For example, 10 children can be born in 1 year in a neighbourhood in which only 10 inhabitants live on January 1, but at the end of the year, for example, 200 inhabitants.

Deaths per 1,000 inhabitants
6 people per 1,000 inhabitants died in 2023 in Neighbourhood Westerkwartier.


One moment please: your device is loading the charts from AllCharts.info.


The graph above shows the development of the number of deaths per 1,000 inhabitants the neighbourhood Westerkwartier.

The figures on mortality per 1,000 inhabitants are based on data from CBS. The relative mortality is determined as the number of deaths from January 1 to December 31, per 1,000 inhabitants on January 1 of the year in question.

More mortality (Dutch)
Data on more than 250 topics!
View the data on all topics in the table below.
TopicCategoryValueUnitYear
Region codeRegionalBU02160008Code2024
Region nameRegionalWesterkwartierName2024
Region typeRegionalBuurtCategorical type2024
Sort codeRegional02160008Code2024
InhabitantsPopulation1,195Number2024
MenPopulation575Number2024
WomenPopulation615Number2024
Ages 0 - 15Population195Number2024
Ages 15 - 25Population115Number2024
Ages 25 - 45Population300Number2024
Ages 45 - 65Population360Number2024
Ages 65 and upPopulation220Number2024
Not marriedPopulation590Number2024
MarriedPopulation440Number2024
DivorcedPopulation110Number2024
WidowedPopulation55Number2024
Origin NetherlandsMigration900Number2024
Origin outside NetherlandsMigration295Number2024
Origin EuropeMigration75Number2024
Origin outside EuropeMigration220Number2024
Born in NetherlandsMigration900Number2024
Born in Netherlands origin EuropeMigration35Number2024
Born in Netherlands origin outside EuropeMigration120Number2024
Born outside Netherlands origin EuropeMigration40Number2024
Born outside Netherlands origin outside EuropeMigration95Number2024
Native DutchMigration935Number2022
Western totalMigration110Number2022
Non-western totalMigration165Number2022
MoroccoMigration55Number2022
Dutch Antilles and ArubaMigration5Number2022
SurinameMigration25Number2022
TurkeyMigration20Number2022
Other non-westernMigration55Number2022
Births totalPopulation15Number2023
Births relativePopulation9Number per 1000 inhabitants2023
Mortality totalPopulation5Number2023
Mortality relativePopulation6Number per 1000 inhabitants2023
Households totalHouseholds540Number2024
Single-person householdsHouseholds180Number2024
Households without childrenHouseholds150Number2024
Households with childrenHouseholds205Number2024
Average household sizeHouseholds2.2Average number2024
Population densityRegional3,145Number per km²2024
Housing stockHouses549Number2024
Newly built dwellingsHousesno dataNumberno data
Non-dwelling stockHouses24Number2024
Newly built non-dwellingsHousesno dataNumberno data
Average house valueHouses€368,000Average number2024
Percentage single-family housesHouses86%Percentage2024
Percentage terraced houseHouses59%Percentage2024
Percentage end-of-terrace houseHouses21%Percentage2024
Percentage semi-detached houseHouses4%Percentage2024
Percentage detached houseHouses2%Percentage2024
Percentage multi-family housesHouses14%Percentage2024
Percentage inhabitedHouses97%Percentage2023
Percentage uninhabitedHouses3%Percentage2024
Percentage privately owned homesHouses59%Percentage2024
Percentage rented homesHouses40%Percentage2024
Percentage rental-housing by corporationHouses26%Percentage2024
Percentage homes other rentalHouses14%Percentage2024
Ownership unknownHouses0%Percentage2023
Percentage homes built before 2000Houses59%Percentage2023
Percentage homes built since 2000Houses41%Percentage2023
Percentage homes built more than ten years agoHouses95%Percentage2024
Percentage homes built in the past ten yearsHouses5%Percentage2024
Average electricity usage totalEnergy consumption2,240Average number per km²2023
Average electricity usage apartmentEnergy consumption1,840Average number per km²2023
Average electricity usage terraced homesEnergy consumption2,200Average number per km²2023
Average electricity usage corner homesEnergy consumption2,370Average number per km²2023
Average electricity usage semi-detached homesEnergy consumption2,410Average number per km²2023
Average electricity usage detached homesEnergy consumption4,310Average number per km²2023
Average electricity usage rental homesEnergy consumption1,950Average number per km²2023
Average electricity usage owner-occupied homesEnergy consumption2,440Average number per km²2023
Average natural gas usage totalEnergy consumption770Average in kWh2023
Average natural gas usage apartmentEnergy consumption680Average in kWh2023
Average natural gas usage terraced homesEnergy consumption730Average in kWh2023
Average natural gas usage corner homesEnergy consumption850Average in kWh2023
Average natural gas usage semi-detached homesEnergy consumption890Average in kWh2023
Average natural gas usage detached homesEnergy consumption1,470Average in kWh2023
Average natural gas usage rental homesEnergy consumption700Average in kWh2023
Average natural gas usage owner-occupied homesEnergy consumption810Average in kWh2023
Percentage homes with district heatingEnergy consumption0%Percentage2014
Primary school studentsEducation90Number2023
Secondary school studentsEducation70Number2023
Vocational education studentsEducation20Number2023
Higher professional education studentsEducation30Number2023
University studentsEducation10Number2023
Basic education levelEducation230Number2023
Intermediate education levelEducation300Number2023
Higher education levelEducation380Number2023
Net labor participationIncome76%Percentage2023
Percentage employeesIncome82%Percentage2023
Percentage self-employedIncome18%Percentage2023
Number of income receiversIncome1,000Number2023
Average income per income recipientIncome€36,800Average number2022
Average income per inhabitantIncome€29,400Average number2022
40% persons with lowest incomeIncome39%Percentage2023
20% persons with highest incomeIncome22%Percentage2023
Average standardized household incomeIncome€36x 1,000 Euro2022
40% households with lowest incomeIncome34%Percentage2023
20% households with highest incomeIncome20%Percentage2023
Households with a low incomeIncome1.0%Percentage2023
Percentage households at social minimumIncome2.9%Percentage2023
Households up to 110% of the social minimumIncome6.6%Percentage2023
Households up to 120% of the social minimumIncome9.7%Percentage2023
Median capital assets of private householdsIncome€160x 1,000 Euro2023
Persons with social security welfareIncome10Number2023
Persons with social security for incapacity for workIncome30Number2023
Persons with social security for unemployedIncome10Number2023
Persons with social security for elderlyIncome200Number2023
Young people with youth care in kindPopulation30Number2023
Percentage young people with youth carePopulation10%Percentage2023
WMO clientsPopulation85Number2023
WMO clients relativePopulation69Number per 1000 inhabitants2023
Businesses totalBusiness150Number2024
Businesses agriculture, forestry, fishingBusiness0Number2024
Businesses industry and energyBusiness10Number2024
Businesses trade and cateringBusiness20Number2024
Businesses transport, information, communicationBusiness20Number2024
Businesses financial services, real estateBusiness5Number2024
Businesses business servicesBusiness40Number2024
Government, education, careBusiness35Number2024
Businesses culture, recreation, other servicesBusiness20Number2024
Passenger cars totalTransport525Number2024
Passenger cars petrolTransport415Number2024
Passenger cars other fuelTransport110Number2024
Passenger cars per householdTransport0.97Number2024
Passenger cars per surfaceRegional1,382Number2024
MotorcyclesTransport45Number2024
Surface totalRegional46Number of hectares2024
Surface landRegional38Number of hectares2024
Surface waterRegional8Number of hectares2024
Degree of urbanizationRegional2Indicator 1-52024
Address densityRegional1,843Average distance in km2024
Addresses totalRegional573Number2025
Addresses with postal codeRegional566Number2025
Addresses with residential functionRegional549Number2025
Addresses with meeting functionRegional6Number2025
Addresses with cell functionRegional0Number2025
Addresses with healthcare functionRegional2Number2025
Addresses with industrial functionRegional2Number2025
Addresses with office functionRegional6Number2025
Addresses with lodging functionRegional0Number2025
Addresses with educational functionRegional2Number2025
Addresses with sports functionRegional1Number2025
Addresses with retail functionRegional4Number2025
Addresses with other usage functionRegional8Number2025
Residential objectsRegional573Number2025
Berth locationsRegional0Number2025
Stand locationsRegional0Number2025
Buildings with addressRegional509Number2025
Addresses with buildingRegional573Number2025
Parcels with addressRegional358Number2025
Addresses with parcelRegional573Number2025
Addresses within built-up areaRegional573Number2025
Addresses outside built-up areaRegional0Number2025
Addresses with residential function within built-up areaRegional549Number2025
Addresses with residential function outside built-up areaRegional0Number2025
Buildings before 1700Regional0Number2025
Buildings 1700 to 1900Regional51Number2025
Buildings 1900 to 1925Regional74Number2025
Buildings 1925 to 1950Regional77Number2025
Buildings 1950 to 1970Regional27Number2025
Buildings 1970 to 1980Regional66Number2025
Buildings 1980 to 1990Regional9Number2025
Buildings 1990 to 2000Regional1Number2025
Buildings 2000 to 2010Regional91Number2025
Buildings 2010 to 2020Regional113Number2025
Buildings 2020 and laterRegional0Number2025
Buildings built before 1700Regional0Number2025
Buildings built from 1700 to 1900Regional53Number2025
Buildings built from 1900 to 1925Regional75Number2025
Buildings built from 1925 to 1950Regional78Number2025
Buildings built from 1950 to 1970Regional34Number2025
Buildings built from 1970 to 1980Regional83Number2025
Buildings built from 1980 to 1990Regional10Number2025
Buildings built from 1990 to 2000Regional12Number2025
Buildings built from 2000 to 2010Regional91Number2025
Buildings built from 2010 to 2020Regional137Number2025
Buildings built from 2020 onwardsRegional0Number2025
Undetermined energy labelEnergy consumption19Number2025
Provisional energy labelEnergy consumption149Number2025
Final energy labelsEnergy consumption405Number2025
Energy label A+++++Energy consumption0Number2025
Energy label A++++Energy consumption0Number2025
Energy label A+++Energy consumption0Number2025
Energy label A++Energy consumption5Number2025
Energy label A+Energy consumption9Number2025
Energy label AEnergy consumption237Number2025
Energy label BEnergy consumption62Number2025
Energy label CEnergy consumption62Number2025
Energy label DEnergy consumption23Number2025
Energy label EEnergy consumption18Number2025
Energy label FEnergy consumption97Number2025
Energy label GEnergy consumption41Number2025
Apartment dwelling typeHouses75Number2025
Terraced or linked dwelling typeHouses326Number2025
Corner dwelling typeHouses116Number2025
Semi-detached dwelling typeHouses20Number2025
Detached dwelling typeHouses12Number2025
Different dwelling typeHouses0Number2025
Unknown dwelling typeHouses0Number2025
Not applicable dwelling typeHouses24Number2025
Zipcode areaRegional4101AE-4101ZZName2025
Most common zipcodeRegional4101Name2025
Coverage percentage most common zipcodeRegional100%Percentage2025
Crime theftCrime18Number2024
Crime violence and sexual abuseCrime3Number2024
Crime environmentalCrime0Number2024
Crime scamCrime9Number2024
Crime trafficCrime12Number2024
Crime destructionCrime3Number2024
Crime otherCrime2Number2024
Crime totalCrime47Number2024
Traffic accidents deadlyTraffic accidents0Number2023
Traffic accidents injuriesTraffic accidents0Number2023
Traffic accidents only material damageTraffic accidents4Number2023
Traffic accidents totalTraffic accidents4Number2023
Distance to general practitionerProximity1.0Average in Euro2023
General practitioners within 1 kmProximity1Average number2023
General practitioners within 3 kmProximity5Average number2023
General practitioners within 5 kmProximity5Average number2023
Distance to general practitioner postProximity17Average in Euro2023
Pharmacy distanceProximity1.2Average in Euro2023
Hospital with outpatient clinic distanceProximity1.0Average in Euro2023
Hospitals with outpatient clinic within 5 kmProximity1Average number2023
Hospitals with outpatient clinic within 10 kmProximity1Average number2023
Hospitals with outpatient clinic within 20 kmProximity6Average number2023
Hospital distanceProximity17Average in Euro2023
Hospitals within 5 kmProximity0Average number2023
Hospitals within 10 kmProximity0Average number2023
Hospitals within 20 kmProximity2Average number2023
Large supermarket distanceProximity0.4Average in Euro2023
Large supermarkets within 1 kmProximity3Average number2023
Large supermarkets within 3 kmProximity8Average number2023
Large supermarkets within 5 kmProximity8Average number2023
Other daily groceries distanceProximity0.3Average in Euro2023
Other daily groceries within 1 kmProximity17Average number2023
Other daily groceries within 3 kmProximity26Average number2023
Other daily groceries within 5 kmProximity27Average number2023
Department store distanceProximity0.8Average in Euro2023
Department stores within 5 kmProximity1Average number2023
Department stores within 10 kmProximity1Average number2023
Department stores within 20 kmProximity14Average number2023
Cafe distanceProximity0.6Average in Euro2023
Cafes within 1 kmProximity5Average number2023
Cafes within 3 kmProximity7Average number2023
Cafes within 5 kmProximity8Average number2023
Snack bar distanceProximity0.4Average in Euro2022
Snack bars within 1 kmProximity16Average number2022
Snack bars within 3 kmProximity21Average number2022
Snack bars within 5 kmProximity21Average number2022
Restaurant distanceProximity0.4Average in Euro2023
Restaurants within 1 kmProximity16Average number2023
Restaurants within 3 kmProximity24Average number2023
Restaurants within 5 kmProximity24Average number2023
Hotel distanceProximity11Average number2022
Hotels within 5 kmProximity0.0Average in Euro2022
Hotels within 10 kmProximity0Average number2022
Hotels within 20 kmProximity21Average number2022
Daycare distanceProximity0.6Average in Euro2023
Daycares within 1 kmProximity4Average number2023
Daycares within 3 kmProximity16Average number2023
Daycares within 5 kmProximity17Average number2023
After-school care distanceProximity0.5Average in Euro2023
After-school care within 1 kmProximity4Average number2023
After-school care within 3 kmProximity19Average number2023
After-school care within 5 kmProximity20Average number2023
Primary education distanceProximity0.5Average in Euro2023
Primary education within 1 kmProximity3Average number2023
Primary education within 3 kmProximity11Average number2023
Primary education within 5 kmProximity11Average number2023
Secondary education total distanceProximity1.3Average in Euro2023
Secondary education total within 3 kmProximity6Average number2023
Secondary education total within 5 kmProximity6Average number2023
Secondary education total within 10 kmProximity6Average number2023
Secondary education VMBO distanceProximity1.3Average in Euro2023
Secondary education VMBO within 3 kmProximity5Average number2023
Secondary education VMBO within 5 kmProximity5Average number2023
Secondary education VMBO within 10 kmProximity5Average number2023
Secondary education HAVO VWO distanceProximity1.3Average in Euro2023
Secondary education HAVO VWO within 3 kmProximity3Average number2023
Secondary education HAVO VWO within 5 kmProximity3Average number2023
Secondary education HAVO VWO within 10 kmProximity3Average number2023
Public green space total distanceProximity0.2Average in Euro2017
Park or garden distanceProximity0.2Average in Euro2017
Day recreational area distanceProximity4.4Average in Euro2017
Forest distanceProximity2.3Average in Euro2017
Open natural area total distanceProximity1.1Average in Euro2017
Open dry natural area distanceProximity9Average in Euro2017
Open wet natural area distanceProximity1.1Average in Euro2017
Semi-public green space total distanceProximity0.8Average in Euro2017
Sports field distanceProximity1.4Average in Euro2017
Allotment garden distanceProximity1.3Average in Euro2017
Residential recreational area distanceProximity1.1Average in Euro2017
Cemetery distanceProximity1.7Average in Euro2017
Recreational inland water distanceProximity0.8Average in Euro2017
Main road access distanceProximity2.0Average in Euro2023
Train station distanceProximity1.2Average in Euro2023
Major transfer station distanceProximity23Average in Euro2023
Library distanceProximity0.7Average in Euro2023
Swimming pool distanceProximity1.8Average in Euro2023
Artificial ice rink distanceProximity27Average in Euro2023
Museum distanceProximity0.7Average in Euro2023
Museums within 5 kmProximity2Average number2023
Museums within 10 kmProximity2Average number2023
Museums within 20 kmProximity17Average number2023
Performing arts distanceProximity0.8Average in Euro2023
Performing arts within 5 kmProximity1Average number2023
Performing arts within 10 kmProximity2Average number2023
Performing arts within 20 kmProximity7Average number2023
Pop venue distanceProximity21Average number2023
Cinema distanceProximity15Average in Euro2023
Cinemas within 5 kmProximity0Average number2023
Cinemas within 10 kmProximity0Average number2023
Cinemas within 20 kmProximity1Average number2023
Sauna distanceProximity22Average number2023
Tanning salon distanceProximity0Average number2023
Attraction distanceProximity10Average in Euro2023
Attractions within 10 kmProximity1Average number2023
Attractions within 20 kmProximity6Average number2023
Attractions within 50 kmProximity39Average number2023
Fire station distanceProximity1Average number2023

Table with more than 250 topics for the neighbourhood Westerkwartier.

👆 The table above shows the latest available data for the neighbourhood Westerkwartier for over 250 topics. The most recent update of the data was done at March 27th, 2025. The rows are sorted by category and subject.

Table usage:

  • Search the table using the search field above the table. This will filter the rows of the table so that only rows containing the search term are displayed.
  • Sort the contents of the table by clicking on the column headers.
  • Navigate through the table using the buttons at the bottom right of the table.
  • On small screens: Scroll the table horizontally to see all columns (the first column remains fixed in view).
Download and data sources
Download as Excel datasets and open data sources used

Download all data for all years and all regional levels for The Netherlands as a whole or a specific municipality. Try this example download for free. (The downloads are currently still in Dutch, translation can be prioritised on request.)

Data is used from multiple Dutch open data providers. See this description of the sources with the definitions of all regional topics.

Sources & definitions