View the information on over 100 topics about borough Biezenmortel in Tilburg in the Netherlands! With graphs, links to more information & an overview of all figures in 1 table.
Population numbers per year
The number of inhabitants in borough Biezenmortel in Tilburg in the Netherlands
Population numbers in borough Biezenmortel in Tilburg in the Netherlands for the years 2013 thru 2023.
The number of inhabitants is the number of persons as registered in the population register on January 1st.
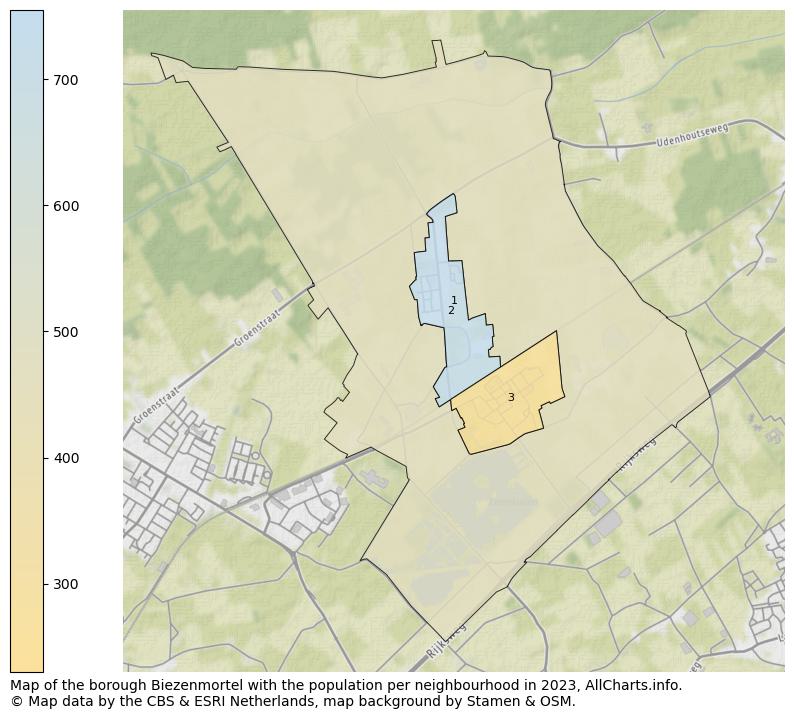
Population at the map of borough Biezenmortel
Map of the borough Biezenmortel with the population per neighbourhood in 2023. The numbers at the map represent the following neighbourhoods: 1: Buitengebied Biezenmortel, 2: Kern Biezenmortel, 3: Huize Assisië.
Have a look at the information for each per borough and neighborhood of Tilburg!
Average value of dwellings
The average of the house values in borough Biezenmortel in Tilburg in the Netherlands
Average dwelling value for the years 2013 thru 2022.
The house value is based on the average WOZ value for all dwellings in borough Biezenmortel in Tilburg in the Netherlands. WOZ is the abbreviation for the Act of Immovable Property valuation. This value is determined yearly by the local government and used for several legal and taxation purposes.
Determination of the real estate value (WOZ value):
When determining the average dwelling value, only real estate objects are included that are registered as homes (main residence or home with practice space). The (provisional) average home value is determined with the valuation date of the previous year (this is based on the WOZ, the Real Estate Valuation Act).
Characteristics of the 589 dwellings in borough Biezenmortel
Percentages of home ownership, occupation, type and construction period.
Definitions of the characteristics of the dwellings in borough Biezenmortel:
Houses by ownership:
Homes for sale are owned by the resident (s) or used as a second home. Rental houses are not occupied by the owner of the house. Rental homes are divided into (1) homes owned by a housing association or other institution. And (2) rental properties owned by companies, individuals and investors.
Houses by occupation:
A house is occupied if, according to the Personal Records Database, at least 1 person was registered at the corresponding address. All other homes are considered uninhabited.
Houses by type:
A house is defined as "multi-family" when it forms a whole building together with other houses or (business) spaces. This includes flats, gallery houses, ground floor and upstairs apartments, and apartments and houses above business premises. All other homes are defined as the "single-family" type.
Houses by contruction period:
The year of construction is the year in which a building containing a home was originally delivered. The construction period as used here has two possible values: (1) built in or after the year 2000 and (2) built before the year 2000.
Population per age group
The percentage of inhabitants per age group in borough Biezenmortel in Tilburg in the Netherlands
Borough Biezenmortel, 2023, age groups.
Population, age groups: percentage of inhabitants per age category.
Civil status
Civil status: unmarried, married, divorced or widowed, Biezenmortel
Borough Biezenmortel, 2023, civil status.
Population, civil status: percentage of inhabitants by civil status (see the explanation for the definitions of marital status, divorced and widowed).
Definitions civil status:
Unmarried:
Persons who have never married or entered into a registered partnership.
Married:
The marital status married arises after a marriage has been concluded or after a registered partnership has been entered into. Married people also include persons who live separated from each other.
Divorced:
The status divorced arises after the dissolution of a marriage or registered partnership other than through the death of the partner. Persons who only live separately (and are still married or registered as partners) are considered to be married..
Widowed:
The civil status widowed arises after dissolution of a marriage or registered partnership due to the death of the partner.
Data about more than 100 topics!
The table below shows data for more than 100 topics as most recently available for borough Biezenmortel in Tilburg in the Netherlands. Select a category to display the related topics:
Persons with social security for incapacity for work
200
number
2021
Persons with social security for unemployed
10
number
2021
Persons with social security for elderly
240
number
2021
Migration
Value
Unit
Year
Native Dutch
1.325
number
2022
Western total
65
number
2022
Not western total
40
number
2022
Marcocco
0
number
2022
Dutch Antilles
10
number
2022
Surinam
0
number
2022
Turkey
0
number
2022
Other not western
25
number
2022
Population
Value
Unit
Year
Inhabitants
1.445
number
2023
Men
820
number
2023
Women
630
number
2023
Ages 0 - 15
185
number
2023
Ages 15 - 25
170
number
2023
Ages 25 - 45
320
number
2023
Ages 45 - 65
485
number
2023
Ages 65 and up
280
number
2023
Not married
795
number
2023
Married
555
number
2023
Divorced
55
number
2023
Widowed
35
number
2023
Births
10
number
2021
Births relative
6
number per 1000 inhabitants
2021
Mortality
20
number
2021
Mortality relative
15
number per 1000 inhabitants
2021
Crime theft
7
number per 1000 inhabitants
2022
Crime violance and sexual abuse
3
number per 1000 inhabitants
2022
Crime environmental
0
number per 1000 inhabitants
2022
Crime scam
5
number per 1000 inhabitants
2022
Crime traffic
8
number per 1000 inhabitants
2022
Crime destruction
10
number per 1000 inhabitants
2022
Crime other
0
number per 1000 inhabitants
2022
Crime total
33
number per 1000 inhabitants
2022
Regional
Value
Unit
Year
Region code
WK085568
code
2023
Region name
Biezenmortel
name
2023
Region type
Wijk
type
2023
Population density
148
number per km2
2023
Passenger cars per surface
74
average per km²
2022
Surface total
1.033
hectares
2023
Surface land
977
hectares
2023
Surface water
56
hectares
2023
Zipcode most occuring
geen data
postal code
2023
Measure of urbanity
5
indicator 1-5
2023
Address density
102
average per km2
2023
Transport
Value
Unit
Year
Passenger cars total
720
number
2022
Passenger cars petrol
540
number
2022
Passenger cars other fuel
175
number
2022
Passenger cars per household
1,50
average
2022
Motorcycles
85
number
2022
Download all data for all years and all regional levels for The Netherlands as a whole or a specific municipality. Try this example download for free. (The downloads are currently still in Dutch, translation can be prioritised on request.)
Open data sources used
Data is used from multiple Dutch open data providers. See this description of the sources with the definitions of all regional topics.
 Contents and more information: