Information about borough Ruwaard:
 Contents and more information:
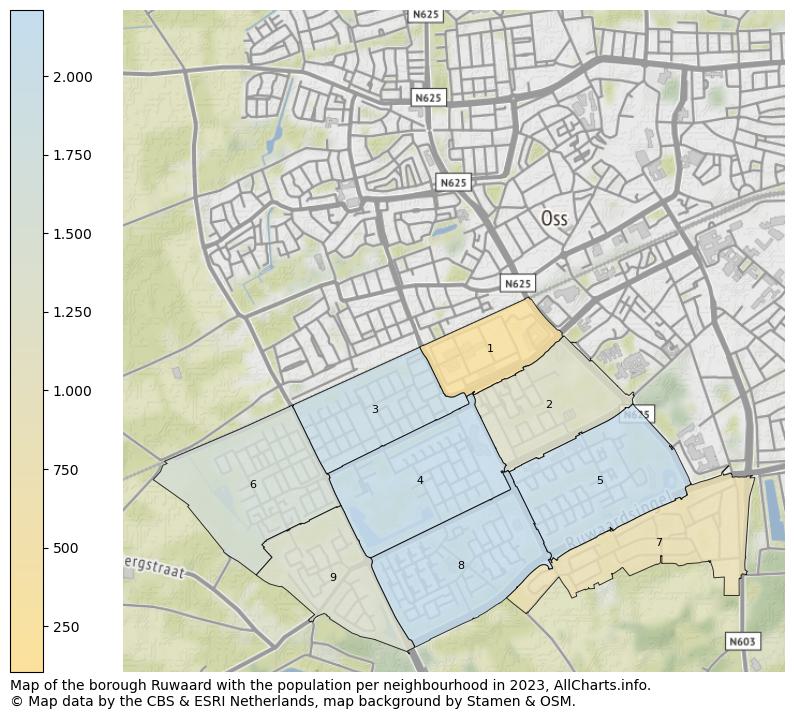
View the information on over 100 topics about borough Ruwaard in Oss in the Netherlands! With graphs, links to more information & an overview of all figures in 1 table.