Information about neighbourhood Isolatorbuurt:

Insufficient data

There is not enough data available for this region to generate the charts.

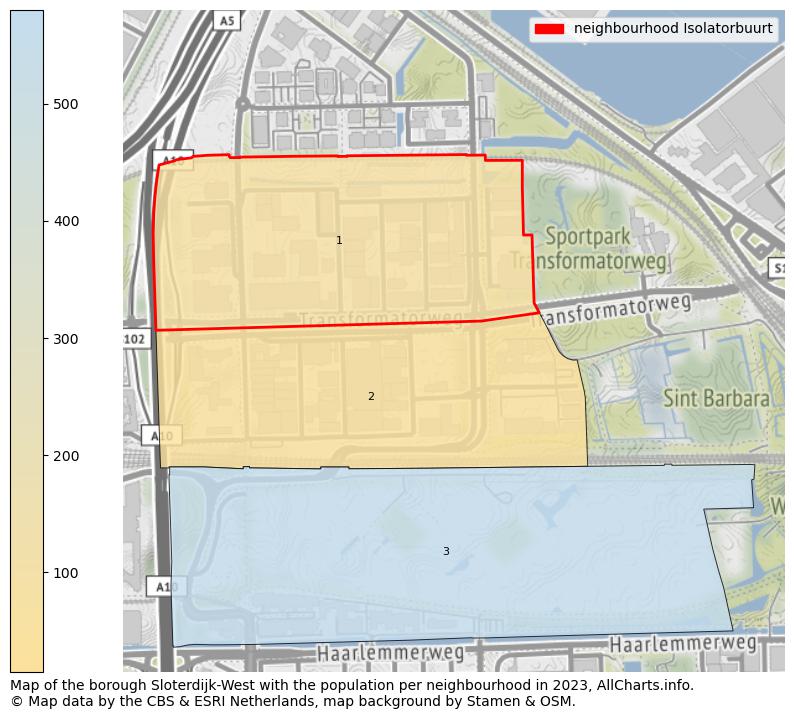
Population at the map of neighbourhood Isolatorbuurt
Map of the borough Sloterdijk-West with the population per neighbourhood in 2023. This page shows a lot of information about residents (such as the distribution by age groups, family composition, gender, native or Dutch with an immigration background, ...), homes (numbers, types, price development, use, type of property, ...) and more (car ownership, energy consumption, ...) based on open data from the Dutch Central Bureau of Statistics and various other sources!

Map of the borough Sloterdijk-West with the population per neighbourhood in 2023. The numbers at the map represent the following neighbourhoods: 1: Isolatorbuurt, 2: Contactbuurt, 3: Woon- en Groengebied Sloterdijk.

Data about more than 100 topics!

The table below shows data for more than 100 topics as most recently available for neighbourhood Isolatorbuurt in Amsterdam in the Netherlands. Select a category to display the related topics:

BusinessValueUnitYear
Businesses total315number2022
Businesses agricultural forestry fishing0number2022
Businesses industry energy29number2022
Businesses trade catering63number2022
Businesses traffic information communications49number2022
Businesses financial service real estate40number2022
Businesses business services83number2022
Government, education, care9number2022
Businesses culture recreation other services43number2022
EnergyValueUnitYear
Average electricity usage total3.450average kWh2021
Average electricity usage appartment2.180average kWh2021
Average electricity usage terraced homesno dataaverage kWhno data
Average electricity usage corner homesno dataaverage kWhno data
Average electricity usage 2 under 1 roof homesno dataaverage kWhno data
Average electricity usage detached homesno dataaverage kWhno data
Average electricity usage rental homes3.540average kWh2021
Average electricity owner-occupied homesno dataaverage kWhno data
Average natural gas usage total1.480average m³2021
Average natural gas usage appartment1.200average m³2021
Average natural gas usage terraced homesno dataaverage m³no data
Average natural gas usage corner homesno dataaverage m³no data
Average natural gas usage 2 under 1 roof homesno dataaverage m³no data
Average natural gas usage detached homesno dataaverage m³no data
Average natural gas usage rental homes1.460average m³2021
Average natural gas owner-occupied homesno dataaverage m³no data
Percentage homes with district heating6%percentage2019
HouseholdsValueUnitYear
Households20number2023
Households 1 person15number2023
Households no children5number2023
Households with children0number2023
Households average size1,20average2023
HousesValueUnitYear
Number of houses8number2022
Average house valueno dataEurono data
Percentage single-family housesno datapercentageno data
Percentage multi-family houses no datapercentageno data
Percentage inhabitedno datapercentageno data
Percentage homes uninhabitedno datapercentageno data
Percentage homes private ownedno datapercentageno data
Percentage homes rentedno datapercentageno data
Percentage rental-housing by a corporationno datapercentageno data
Percentage homes other rentalno datapercentageno data
Homes ownership unknownno datapercentageno data
Percentage homes built before 2000no datapercentageno data
Percentage homes built since 2000no datapercentageno data
IncomeValueUnitYear
Number of income receivers60number2021
Average income per income receipientno dataEurono data
Average income per inhabitantno dataEurono data
40 percentile persons with lowest incomeno datapercentageno data
20 percentile persons with highest incomeno datapercentageno data
Active persons 15-75 yearno datapercentageno data
40 percentile households with lowest incomeno datapercentageno data
20 percentile households with highest incomeno datapercentageno data
Percentage households with a low incomeno datapercentageno data
Percentage households at social minimumno datapercentageno data
Persons with social security welfare0number2021
Persons with social security for incapacity for work6number2021
Persons with social security for unemployed0number2021
Persons with social security for elderly0number2021
MigrationValueUnitYear
Native Dutch14number2022
Western total14number2022
Not western total14number2022
Marcocco3number2022
Dutch Antilles0number2022
Surinam6number2022
Turkey3number2022
Other not western6number2022
PopulationValueUnitYear
Inhabitants60number2023
Men50number2023
Women15number2023
Ages 0 - 150number2023
Ages 15 - 250number2023
Ages 25 - 4525number2023
Ages 45 - 6530number2023
Ages 65 and up5number2023
Not married55number2023
Married5number2023
Divorced5number2023
Widowed0number2023
Births0number2021
Births relative0number per 1000 inhabitants2021
Mortality0number2021
Mortality relative17number per 1000 inhabitants2021
Crime theft72number per 1000 inhabitants2022
Crime violance and sexual abuse11number per 1000 inhabitants2022
Crime environmental0number per 1000 inhabitants2022
Crime scam6number per 1000 inhabitants2022
Crime traffic12number per 1000 inhabitants2022
Crime destruction39number per 1000 inhabitants2022
Crime other9number per 1000 inhabitants2022
Crime total147number per 1000 inhabitants2022
RegionalValueUnitYear
Region codeBU0363EA01code2023
Region nameIsolatorbuurtname2023
Region typeBuurttype2023
Population density181number per km22023
Passenger cars per surface199average per km²2022
Surface total35hectares2023
Surface land35hectares2023
Surface water0hectares2023
Zipcode most occuring1014.0postal code2023
Measure of urbanity4indicator 1-52023
Address density654average per km22023
TransportValueUnitYear
Passenger cars total77number2022
Passenger cars petrol52number2022
Passenger cars other fuel26number2022
Passenger cars per household2,00average2022
Motorcycles3number2022

Download all data for all years and all regional levels for The Netherlands as a whole or a specific municipality. Try this example download for free. (The downloads are currently still in Dutch, translation can be prioritised on request.)

Open data sources used

Data is used from multiple Dutch open data providers. See this description of the sources with the definitions of all regional topics.

Sources & definitions
Under development
Work is in progress to add more information to this page

This page will be further expanded with more topics in clear graphs. This will be done in several iterations in the coming weeks.