View the information on over 100 topics about neighbourhood Knarbos in Lelystad in the Netherlands! With graphs, links to more information & an overview of all figures in 1 table.
Insufficient data
There is not enough data available for this region to generate the charts.
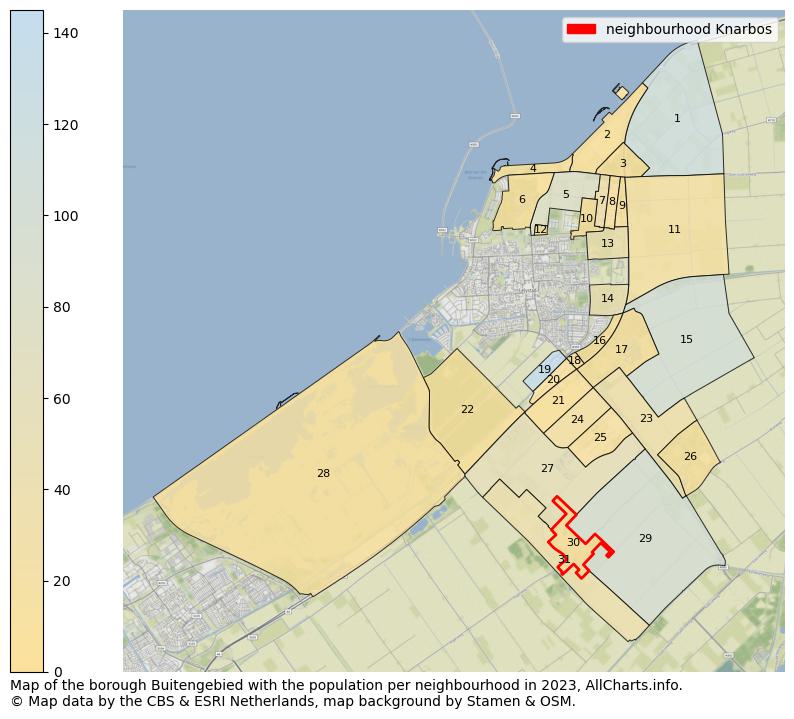
Population at the map of neighbourhood Knarbos
Map of the borough Buitengebied with the population per neighbourhood in 2023. The numbers at the map represent the following neighbourhoods: 1: Visvijver- Bijl- Klokbeker- Plavuizenweg, 2: Karperweg IJsselmeerdijk, 3: Visvijverbos, 4: Strand Houtribhoek Houtribbos, 5: Beginweg Bronsweg Jupiterweg ...Show more...Map of the borough Buitengebied with the population per neighbourhood in 2023. The numbers at the map represent the following neighbourhoods: 1: Visvijver- Bijl- Klokbeker- Plavuizenweg, 2: Karperweg IJsselmeerdijk, 3: Visvijverbos, 4: Strand Houtribhoek Houtribbos, 5: Beginweg Bronsweg Jupiterweg, 6: Zuigerplaspark, 7: Industrieterrein Oostervaart West, 8: Industrieterrein Oostervaart Midden, 9: Industrieterrein Oostervaart Oost, 10: Overijsselse Hout Jagersbos, 11: Edelhert- Runder- Wisent- Elandweg, 12: Sportveld Beginweg Overijsselse Hout, 13: Overijsselse Hout Hoefslag Hondsdraf, 14: Gelderse Hout, 15: Lisdodde- Dronter- Zeeasterweg -pad, 16: Flevobos, 17: Natuurpark Lelystad, 18: Larserplein, 19: Flevopoort II, 20: Flevopoort I, 21: Bedrijvenpark Larserpoort, 22: Hollandse Hout, 23: Vlotgrasweg, 24: Larservaartbos, 25: Airport Lelystad, 26: Larserbos Rietweg, 27: Meerkoetenweg Eendenweg Larserpad, 28: Oostvaardersplassen, 29: Vogelweg Meeuwenweg Pijlstaartweg, 30: Knarbos, 31: Pijlstaartweg Vleetweg Larserweg ...Show less...
The table below shows data for more than 100 topics as most recently available for neighbourhood Knarbos in Lelystad in the Netherlands. Select a category to display the related topics:
Persons with social security for incapacity for work
0
number
2014
Persons with social security for unemployed
0
number
2014
Persons with social security for elderly
0
number
2014
Migration
Value
Unit
Year
Native Dutch
0
number
2022
Western total
0
number
2022
Not western total
0
number
2022
Marcocco
0
number
2022
Dutch Antilles
0
number
2022
Surinam
0
number
2022
Turkey
0
number
2022
Other not western
0
number
2022
Population
Value
Unit
Year
Inhabitants
0
number
2023
Men
0
number
2023
Women
0
number
2023
Ages 0 - 15
0
number
2023
Ages 15 - 25
0
number
2023
Ages 25 - 45
0
number
2023
Ages 45 - 65
0
number
2023
Ages 65 and up
0
number
2023
Not married
0
number
2023
Married
0
number
2023
Divorced
0
number
2023
Widowed
0
number
2023
Births
0
number
2021
Births relative
0
number per 1000 inhabitants
2021
Mortality
0
number
2021
Mortality relative
0
number per 1000 inhabitants
2021
Crime theft
0
number per 1000 inhabitants
2022
Crime violance and sexual abuse
0
number per 1000 inhabitants
2022
Crime environmental
0
number per 1000 inhabitants
2022
Crime scam
0
number per 1000 inhabitants
2022
Crime traffic
0
number per 1000 inhabitants
2022
Crime destruction
0
number per 1000 inhabitants
2022
Crime other
0
number per 1000 inhabitants
2022
Crime total
0
number per 1000 inhabitants
2022
Regional
Value
Unit
Year
Region code
BU09951067
code
2023
Region name
Knarbos
name
2023
Region type
Buurt
type
2023
Population density
5
number per km2
2014
Passenger cars per surface
0
average per km²
2022
Surface total
260
hectares
2023
Surface land
258
hectares
2023
Surface water
2
hectares
2023
Zipcode most occuring
8218.0
postal code
2023
Measure of urbanity
5
indicator 1-5
2023
Address density
2
average per km2
2023
Transport
Value
Unit
Year
Passenger cars total
0
number
2022
Passenger cars petrol
0
number
2022
Passenger cars other fuel
0
number
2022
Passenger cars per household
no data
average
no data
Motorcycles
0
number
2022
Download all data for all years and all regional levels for The Netherlands as a whole or a specific municipality. Try this example download for free. (The downloads are currently still in Dutch, translation can be prioritised on request.)
Open data sources used
Data is used from multiple Dutch open data providers. See this description of the sources with the definitions of all regional topics.
 Contents and more information: